Fig. 5.
Download original image
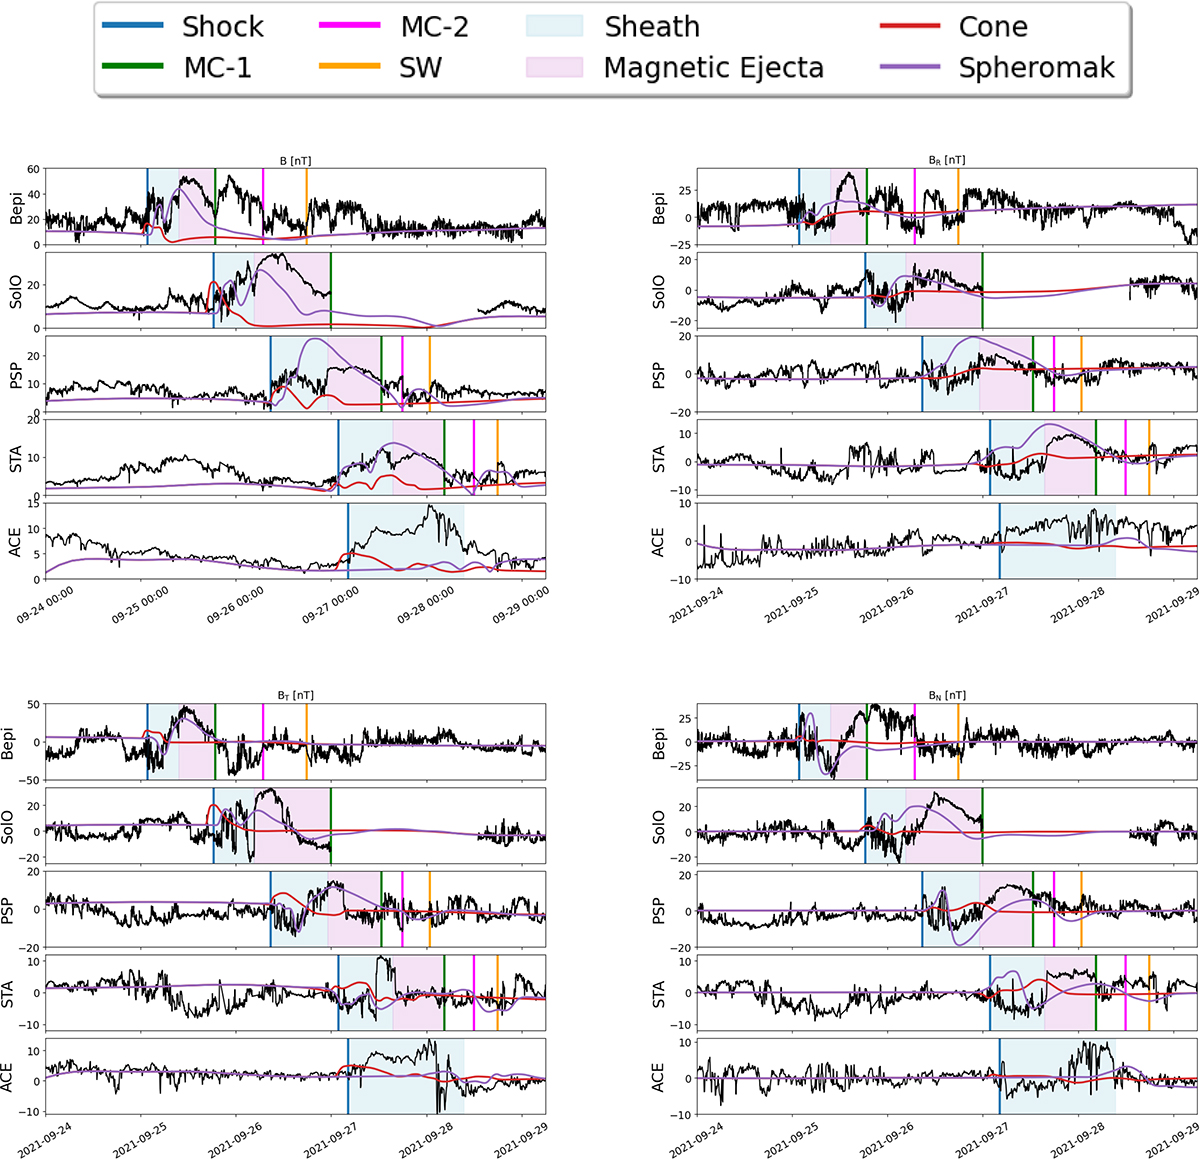
Magnetic field magnitude and magnetic field components in RTN coordinates at each spacecraft. The observational data are plotted in black, and the two CME models propagated in the steady solar wind, namely a cone and a spheromak CME model, are represented by the red and purple curves, respectively. The blue and pink shaded areas correspond to the sheath and magnetic ejecta regions, as defined by in situ observations. The vertical blue line shows the arrival of the shock, the vertical green line corresponds to the end of the magnetic cloud of the CME, the magenta line corresponds to the end of the second magnetic cloud, and the vertical orange line shows the end of a part of the solar wind following the CME.
Current usage metrics show cumulative count of Article Views (full-text article views including HTML views, PDF and ePub downloads, according to the available data) and Abstracts Views on Vision4Press platform.
Data correspond to usage on the plateform after 2015. The current usage metrics is available 48-96 hours after online publication and is updated daily on week days.
Initial download of the metrics may take a while.