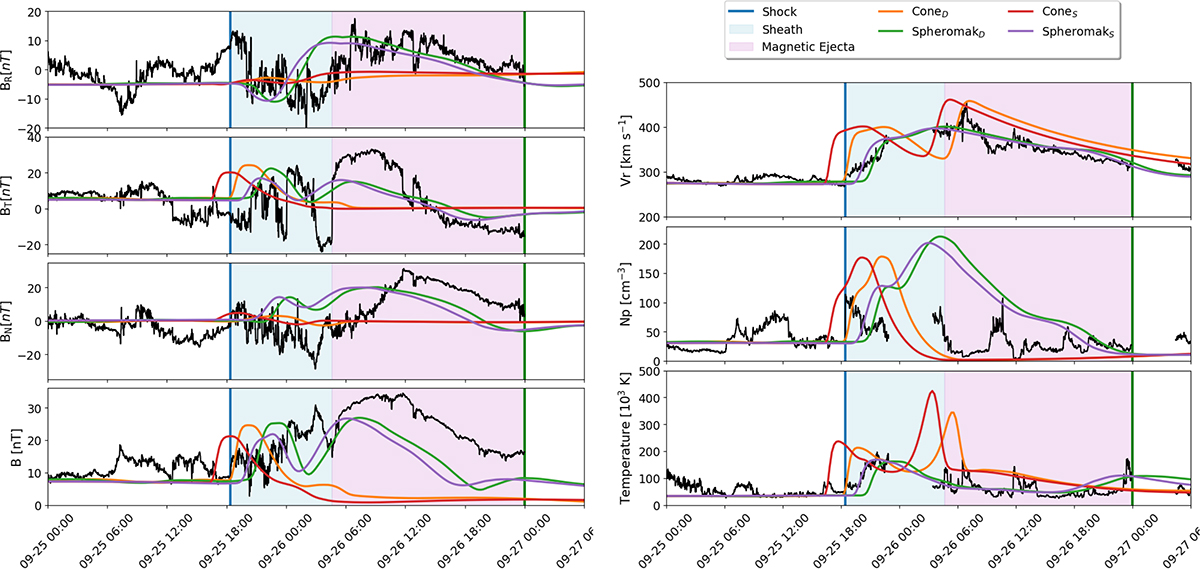
Fig. 7.
Download original image
Time series of the magnetic (left) and plasma (right) variables at Solar Orbiter. The shock is indicated with the vertical blue line. The green line denotes the passing of the magnetic ejecta. The blue and pink shades indicate the sheath and the regions of magnetic ejecta. The dynamic solar wind simulations, using the cone and spheromak CME models, are depicted in orange and green, respectively. The steady solar wind simulations with cone and spheromak CMEs are shown in red and purple.
Current usage metrics show cumulative count of Article Views (full-text article views including HTML views, PDF and ePub downloads, according to the available data) and Abstracts Views on Vision4Press platform.
Data correspond to usage on the plateform after 2015. The current usage metrics is available 48-96 hours after online publication and is updated daily on week days.
Initial download of the metrics may take a while.