Fig. 1
Download original image
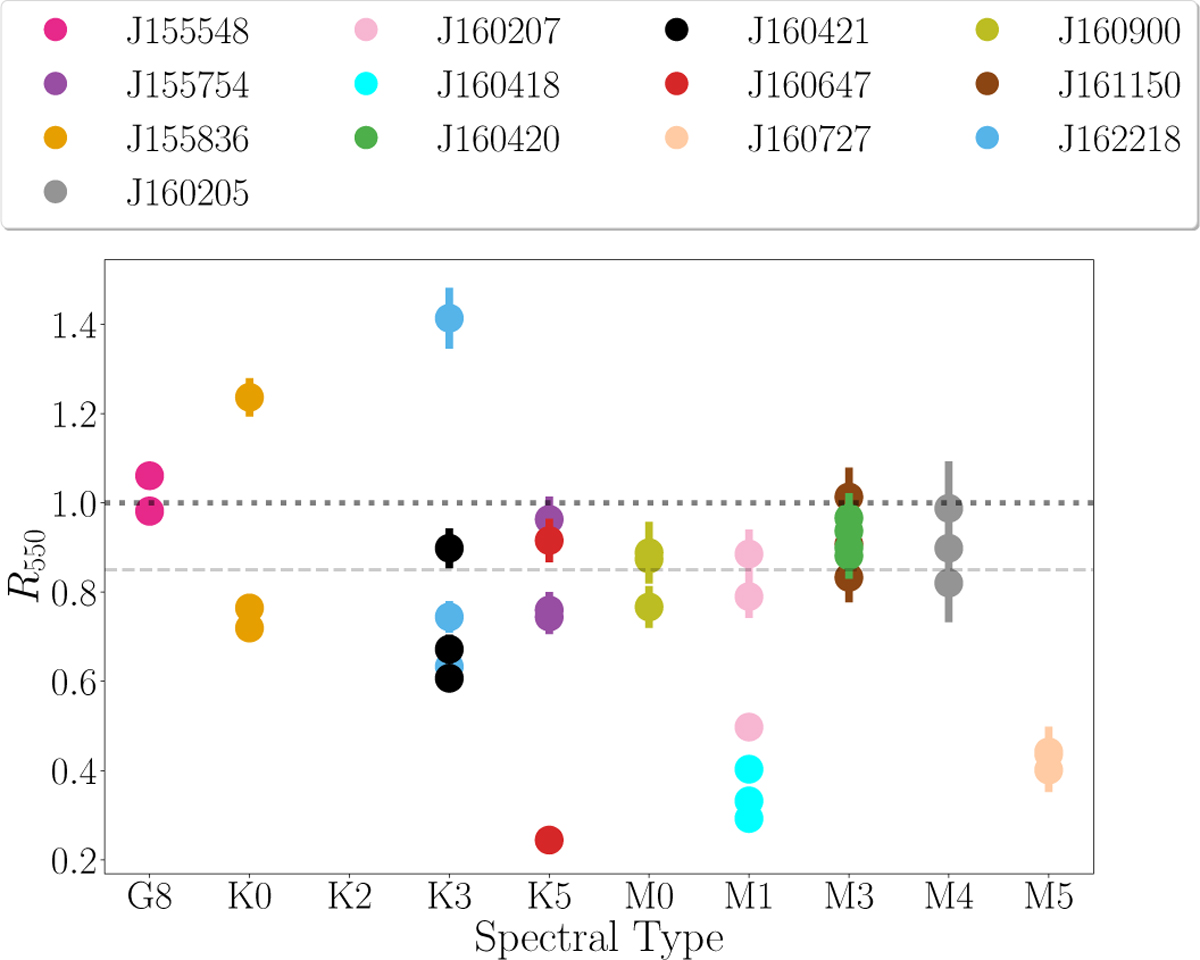
Ratios of the observed to photospheric flux at 550 nm (R550) for each star (see colour legend) are shown as a function of the spectral type. When not visible, the errors are smaller than the size of the dots. Dotted and dashed grey lines represent R550thresholds of 1.0, 0.85 respectively. No relation between spectral type and R550is observed.
Current usage metrics show cumulative count of Article Views (full-text article views including HTML views, PDF and ePub downloads, according to the available data) and Abstracts Views on Vision4Press platform.
Data correspond to usage on the plateform after 2015. The current usage metrics is available 48-96 hours after online publication and is updated daily on week days.
Initial download of the metrics may take a while.