Fig. D.1
Download original image
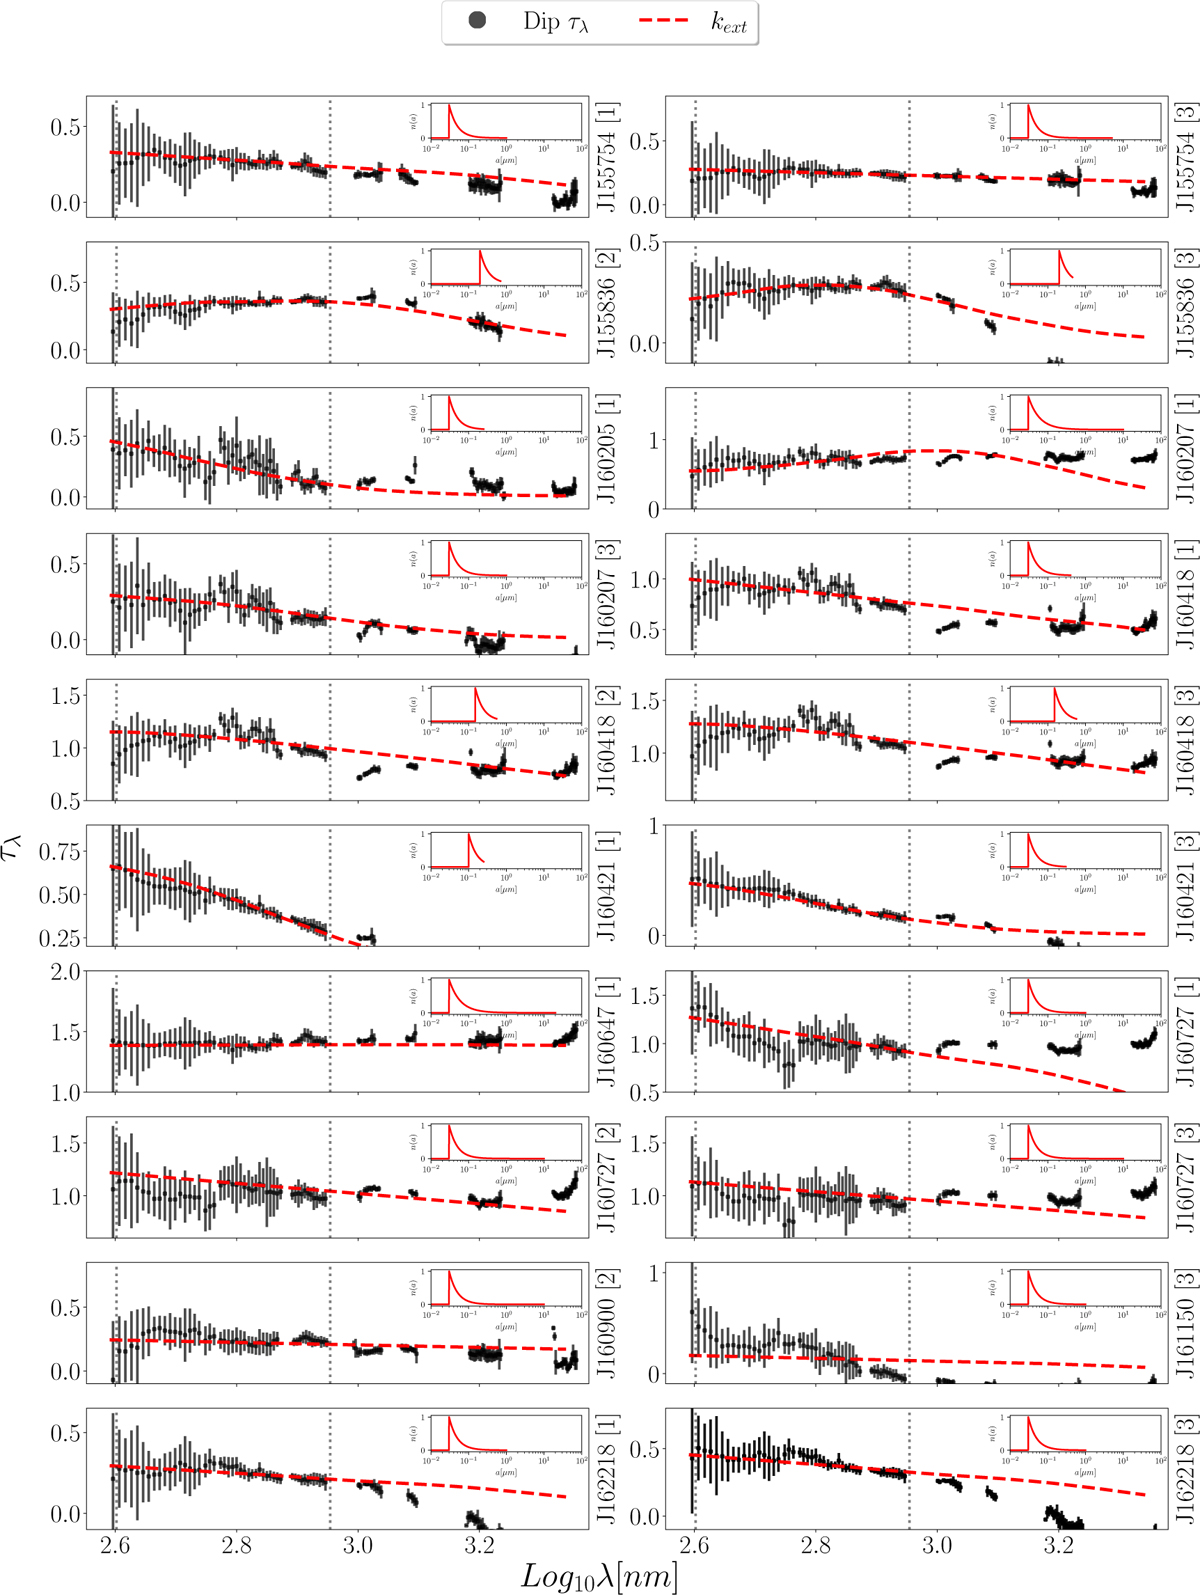
τλ as a function of λ for all the 20 dips analysed in Sect.4. The name of the star and the epoch number are given on the secondary axis. The observed values are shown by black dots with error bars. The red coloured lines show the results for the grain size distribution that best fit the data in the wavelength interval 400-900 nm for the extinction opacities, each normalised to the observed value at 550 nm. The values of amin, amax, q are given on top of each panel; the corresponding grain size distribution is displayed in the insert. The vertical grey dotted lines represent the boundaries of λ = 400, 900 nm. Three representative cases are also shown in the main paper.
Current usage metrics show cumulative count of Article Views (full-text article views including HTML views, PDF and ePub downloads, according to the available data) and Abstracts Views on Vision4Press platform.
Data correspond to usage on the plateform after 2015. The current usage metrics is available 48-96 hours after online publication and is updated daily on week days.
Initial download of the metrics may take a while.