Fig. 3
Download original image
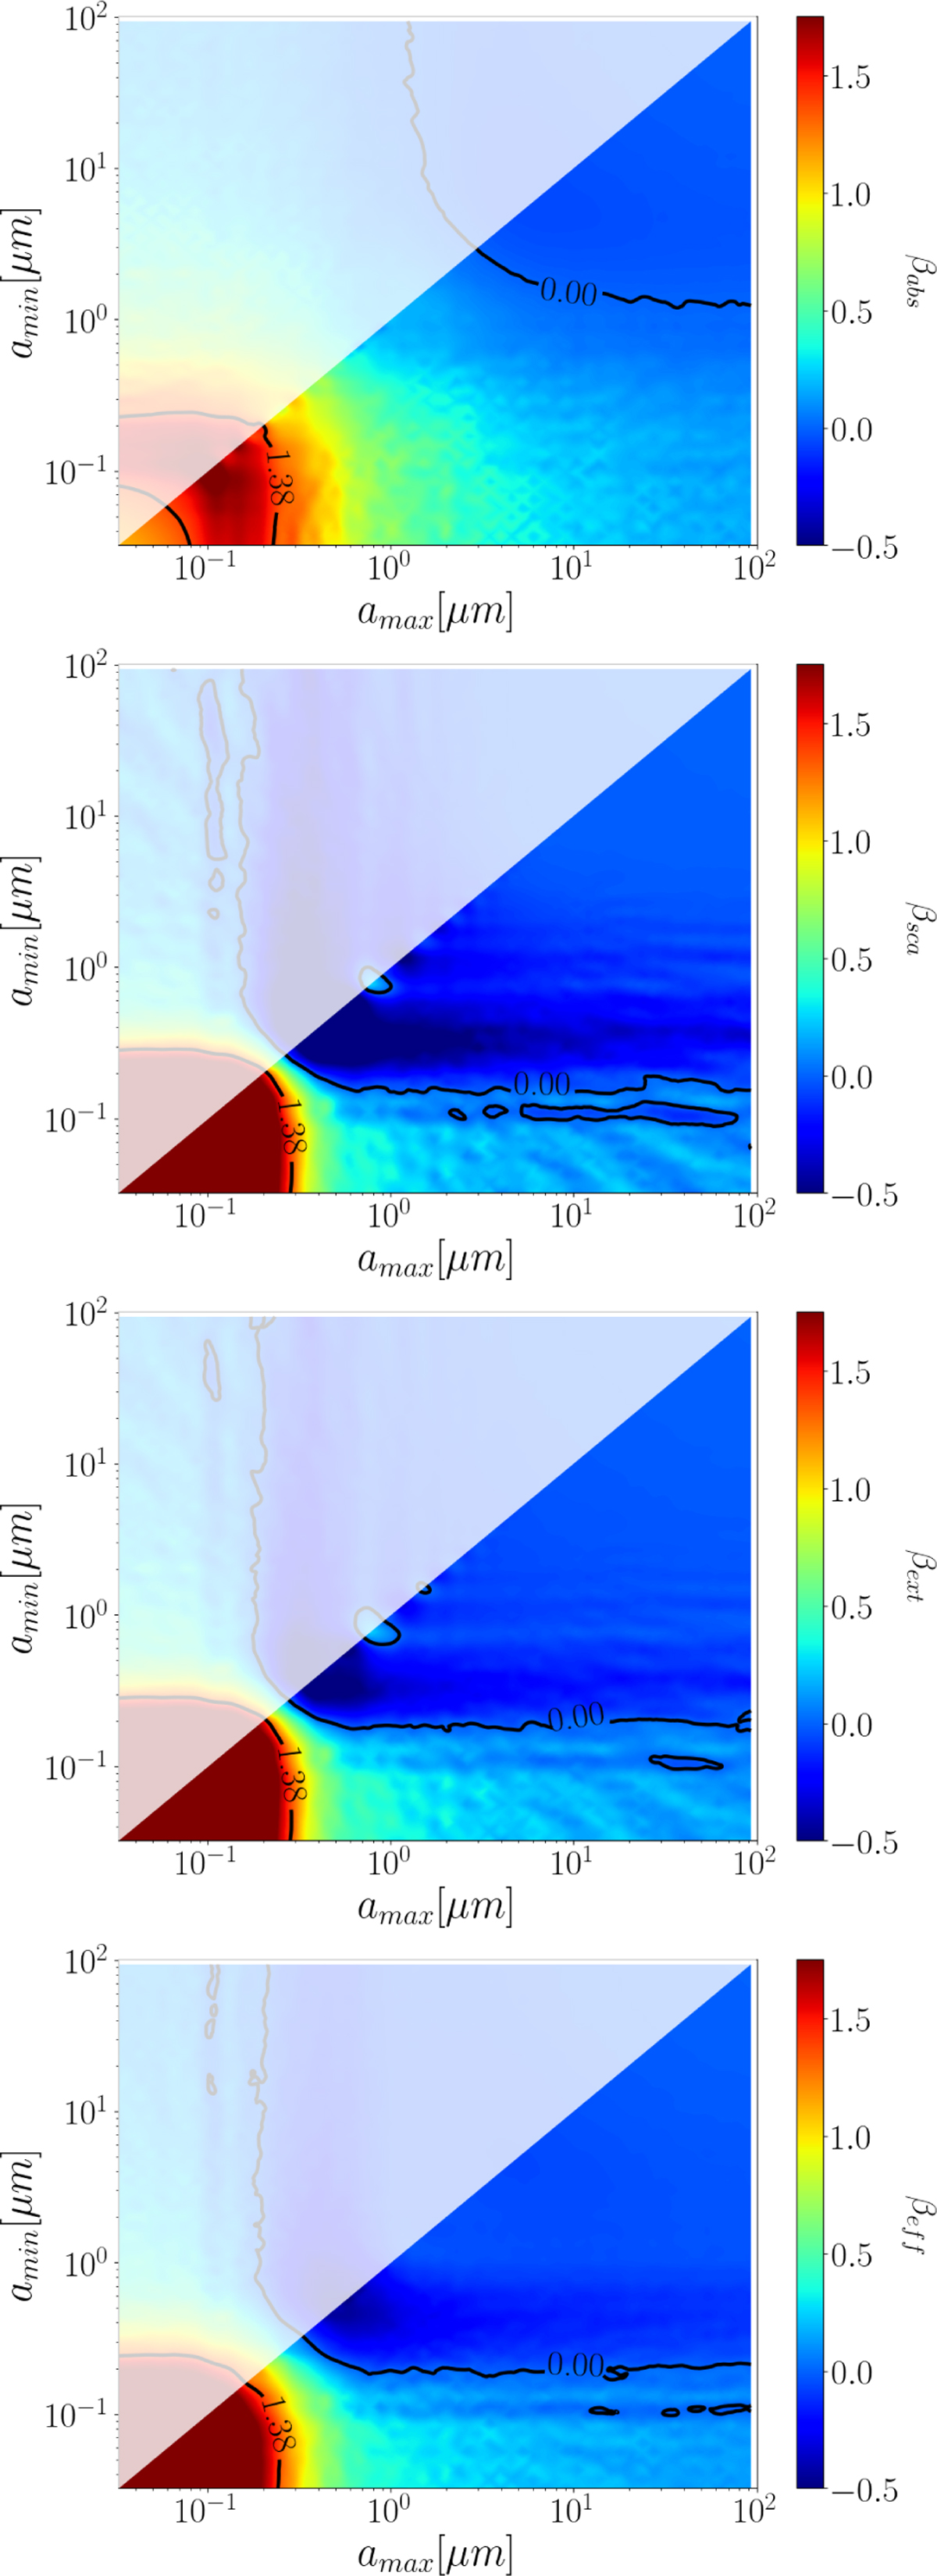
β colour maps from dust opacity models. Each figure represents a grid of dust size distributions varying minimum and maximum grain sizes (n(a) ∝ a−q with q=3.0). Coloured by the values of β derived from the opacities for (a) pure absorption (βabs), (b)scattering (βsca), (c) extinction (βext), and (d) effective extinction (βeff; see text). Contours are marked by black lines at β = 0.0 and βism = 1.38). Pattern effects are artefacts of the interpolation used.
Current usage metrics show cumulative count of Article Views (full-text article views including HTML views, PDF and ePub downloads, according to the available data) and Abstracts Views on Vision4Press platform.
Data correspond to usage on the plateform after 2015. The current usage metrics is available 48-96 hours after online publication and is updated daily on week days.
Initial download of the metrics may take a while.