Fig. 5
Download original image
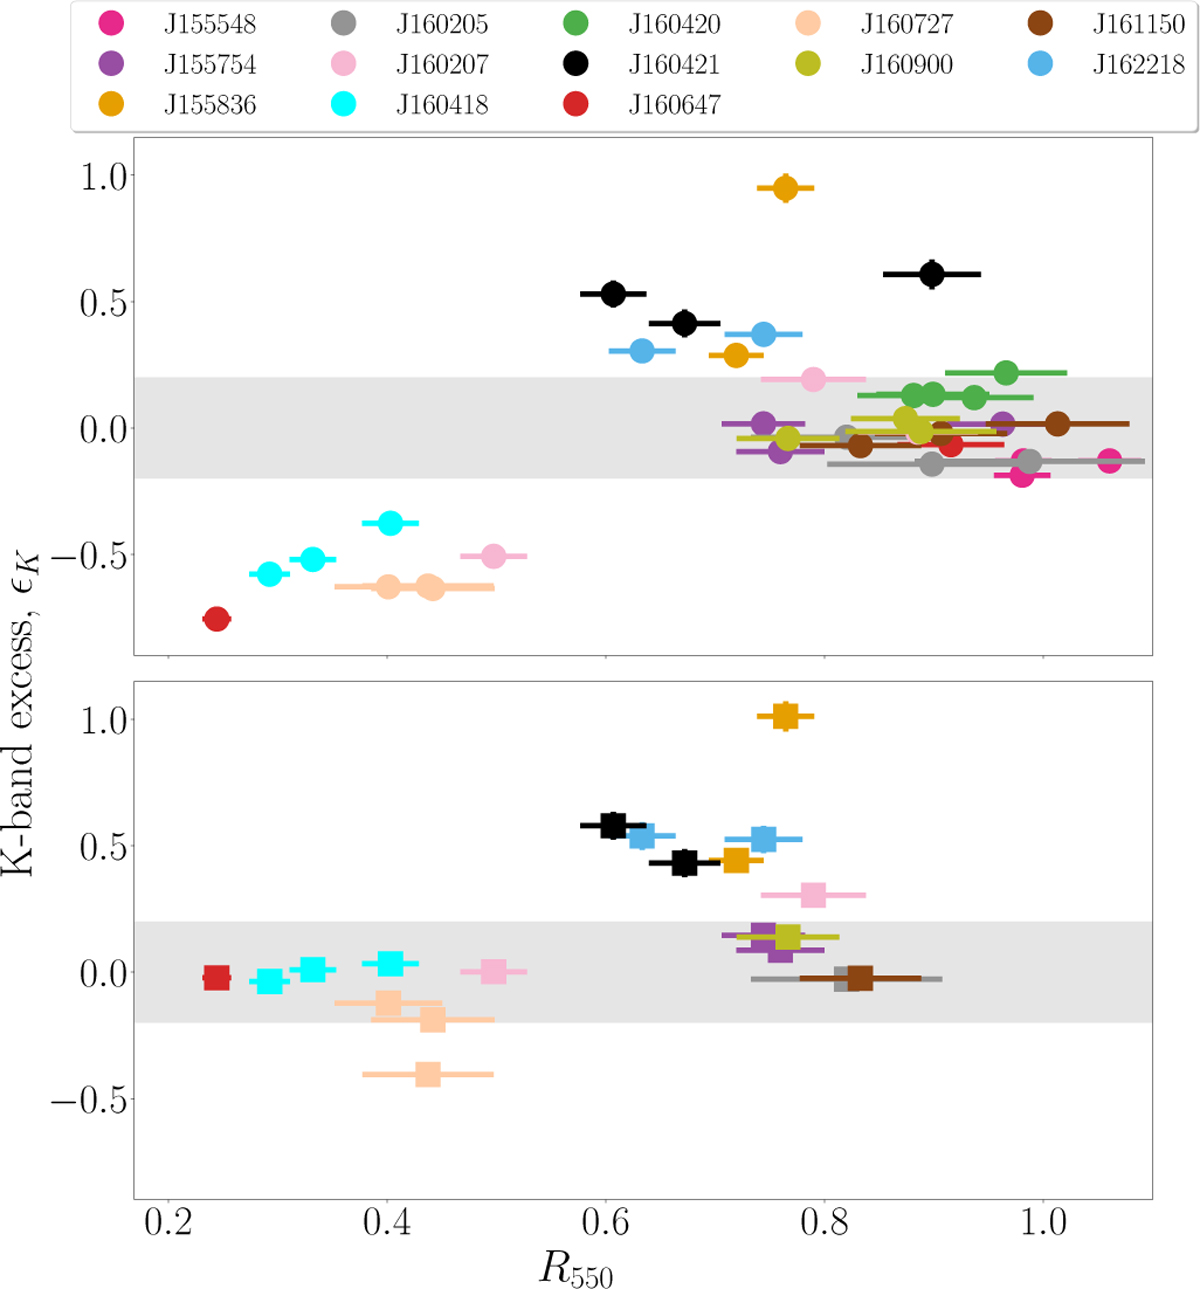
Excess emission at 2.1 μm, εK shown as a function of R550. The top panel plots the ratio between the observed flux and the intrinsic photospheric one (![]() ). The bottom panel shows the ratio between the observed flux corrected for the extinction derived at optical wavelengths and the photospheric flux (
). The bottom panel shows the ratio between the observed flux corrected for the extinction derived at optical wavelengths and the photospheric flux (![]() ). The grey area covers a ±20% region around εK = 0. Vertical error bars on εK are smaller than the size of the points.
). The grey area covers a ±20% region around εK = 0. Vertical error bars on εK are smaller than the size of the points.
Current usage metrics show cumulative count of Article Views (full-text article views including HTML views, PDF and ePub downloads, according to the available data) and Abstracts Views on Vision4Press platform.
Data correspond to usage on the plateform after 2015. The current usage metrics is available 48-96 hours after online publication and is updated daily on week days.
Initial download of the metrics may take a while.