Fig. B.1
Download original image
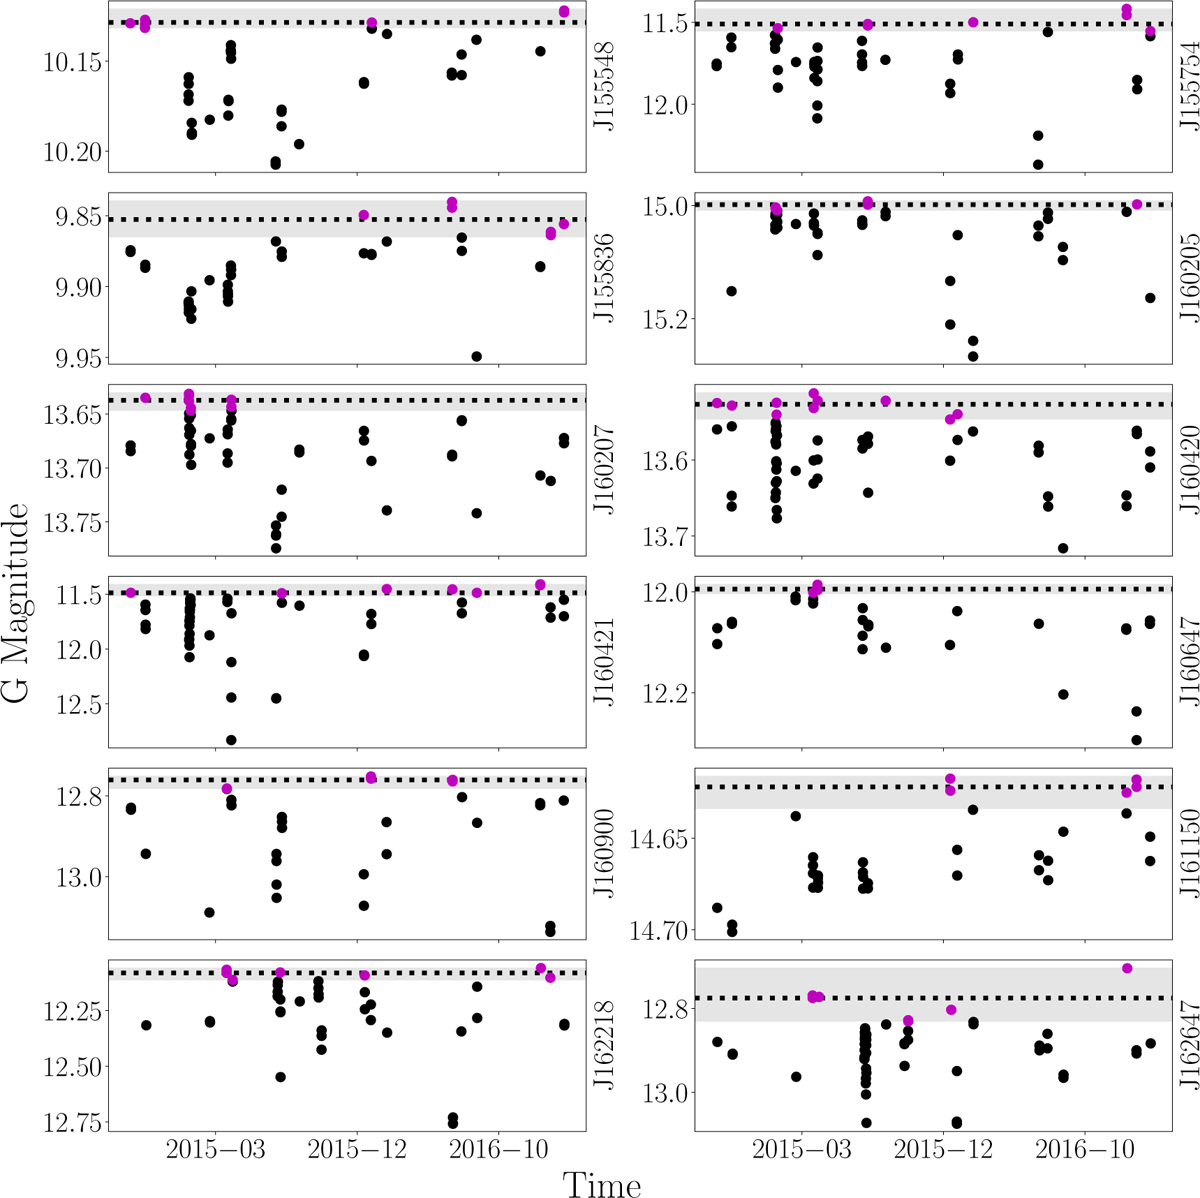
G-band magnitudes observed by the Gaia Variability programme (Gaia Collaboration 2016, 2023) for all the objects included in the Gaia dataset. In each panel, the observed magnitudes are shown by dots. The shaded region defines the range between the minimum and 85% of it (i.e. the range of the brightest values). The dotted line shows the median of the points included in this range (in magenta), and is assumed to be the G-band magnitude of the stellar photosphere.
Current usage metrics show cumulative count of Article Views (full-text article views including HTML views, PDF and ePub downloads, according to the available data) and Abstracts Views on Vision4Press platform.
Data correspond to usage on the plateform after 2015. The current usage metrics is available 48-96 hours after online publication and is updated daily on week days.
Initial download of the metrics may take a while.