Fig. 2.
Download original image
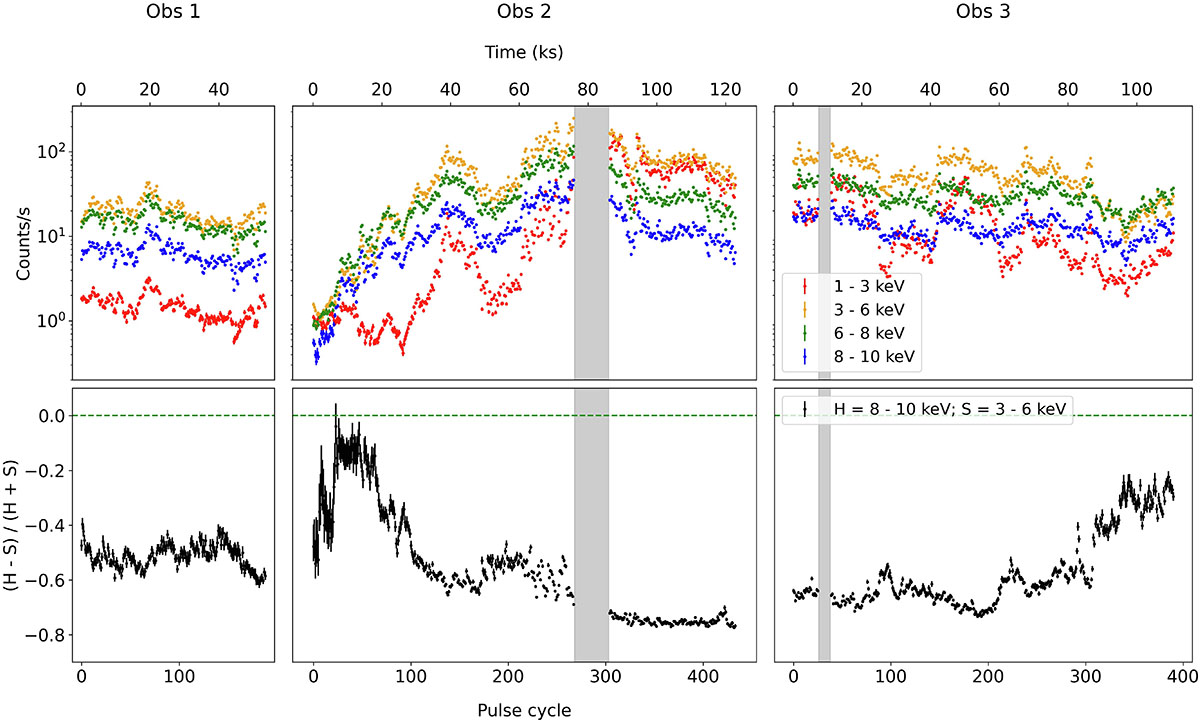
Energy-resolved light curves (top panels) and HRs (Eq. 1) between the 8–10 and 3–6 keV bands (bottom panels), with a time resolution of the respective pulse period, for the three observations. The width of each column is proportional to the duration of the corresponding observation. The light curves are plotted on a logarithmic scale for clarity. The colors represent different energy bands following the legend in the plot. Gray areas mark intervals of bright flares excluded for time-resolved analysis (see Sect. 3.1 and Table 3).
Current usage metrics show cumulative count of Article Views (full-text article views including HTML views, PDF and ePub downloads, according to the available data) and Abstracts Views on Vision4Press platform.
Data correspond to usage on the plateform after 2015. The current usage metrics is available 48-96 hours after online publication and is updated daily on week days.
Initial download of the metrics may take a while.