Open Access
Fig. 8.
Download original image
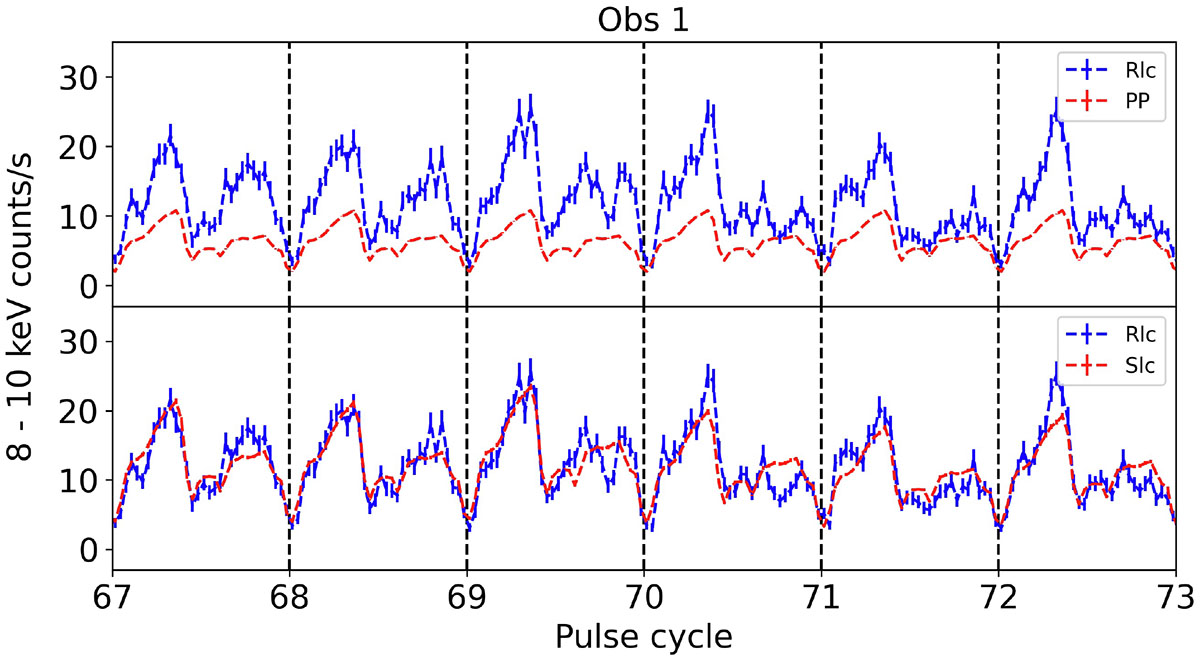
Demonstration of the approach to generate the Slc by scaling the repeated PP to match the mean flux of the corresponding pulse cycle of the Rlc. The top panel shows the Rlc and the repeated PP before scaling, while the bottom panel shows the Rlc and the final Slc. See Sect. 5.3.1 for more details.
Current usage metrics show cumulative count of Article Views (full-text article views including HTML views, PDF and ePub downloads, according to the available data) and Abstracts Views on Vision4Press platform.
Data correspond to usage on the plateform after 2015. The current usage metrics is available 48-96 hours after online publication and is updated daily on week days.
Initial download of the metrics may take a while.