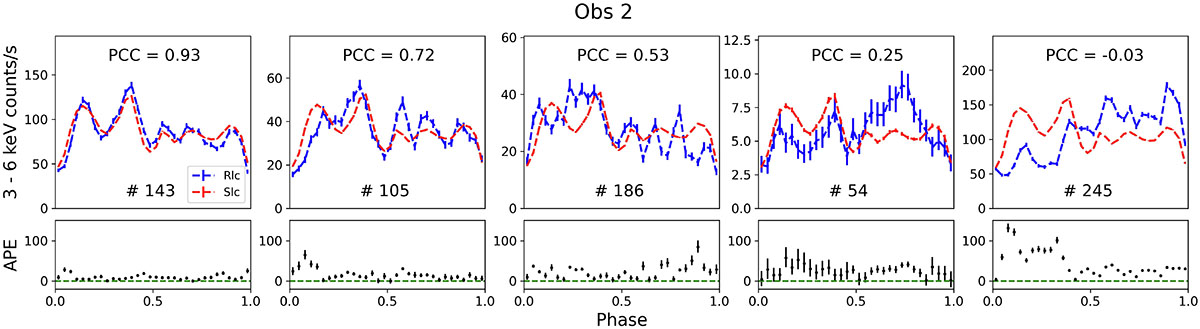
Fig. 9.
Download original image
Comparison between the Rlc and the Slc for some pulse cycles of Obs 2 in the 3–6 keV range. The pulse cycle number is indicated right after the symbol # in the top panels. The generation of the Slc is explained in Sect. 5.3.1. The similarity between the Rlc and the Slc decreases from left to right, as quantified by PCC (obtained with Eq. 4) and APE (obtained with Eq. 5).
Current usage metrics show cumulative count of Article Views (full-text article views including HTML views, PDF and ePub downloads, according to the available data) and Abstracts Views on Vision4Press platform.
Data correspond to usage on the plateform after 2015. The current usage metrics is available 48-96 hours after online publication and is updated daily on week days.
Initial download of the metrics may take a while.