Fig. 10
Download original image
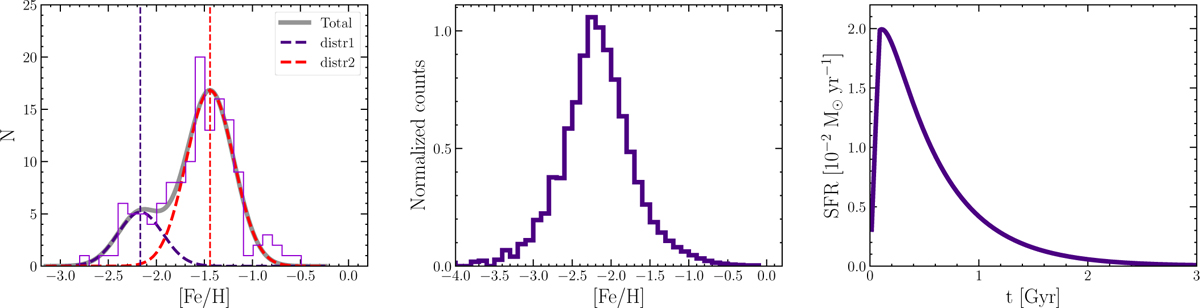
Division of the MDF of the Thamnos substructure (see Fig. 4 bottom panel) into two distributions to identify the ‘true’ Thamnos component and the contamination from in situ stars (left panel) and MDF, SFH as predicted by the model built for Thamnos progenitor presented in Section 5.1 (two rightmost panels). In the left panel, the ‘true’ Thamnos distribution traced by observation is labelled with ‘distr1’ (dashed blue line), while MW in situ contamination would be represented by ‘distr2’ (dashed red line).
Current usage metrics show cumulative count of Article Views (full-text article views including HTML views, PDF and ePub downloads, according to the available data) and Abstracts Views on Vision4Press platform.
Data correspond to usage on the plateform after 2015. The current usage metrics is available 48-96 hours after online publication and is updated daily on week days.
Initial download of the metrics may take a while.