Fig. 11.
Download original image
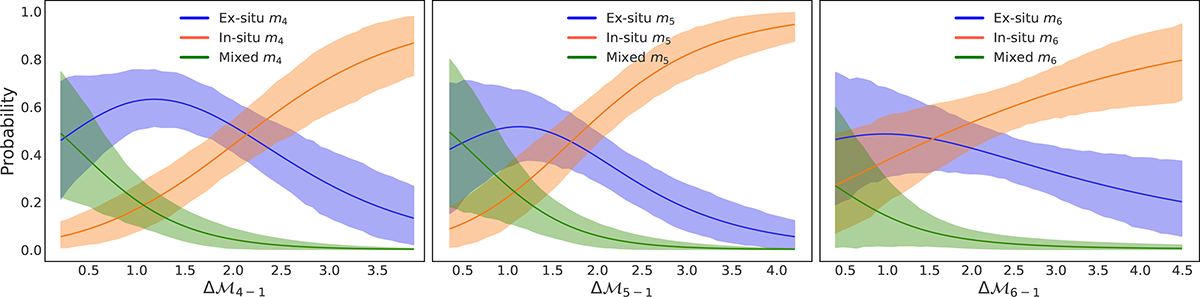
Fractional probabilities, accounting for the relative abundances of the assembly histories of the corresponding satellites, that the magnitude gaps Δℳ4−1 (left), Δℳ5−1 (middle), and Δℳ6−1 (right) take on a specific value at the end of the simulations. Transparent shaded bands show interquartile ranges for ex situ (blue), in situ (orange), and mixed (green) assembly modes, with solid lines indicating medians.
Current usage metrics show cumulative count of Article Views (full-text article views including HTML views, PDF and ePub downloads, according to the available data) and Abstracts Views on Vision4Press platform.
Data correspond to usage on the plateform after 2015. The current usage metrics is available 48-96 hours after online publication and is updated daily on week days.
Initial download of the metrics may take a while.