Fig. A.1.
Download original image
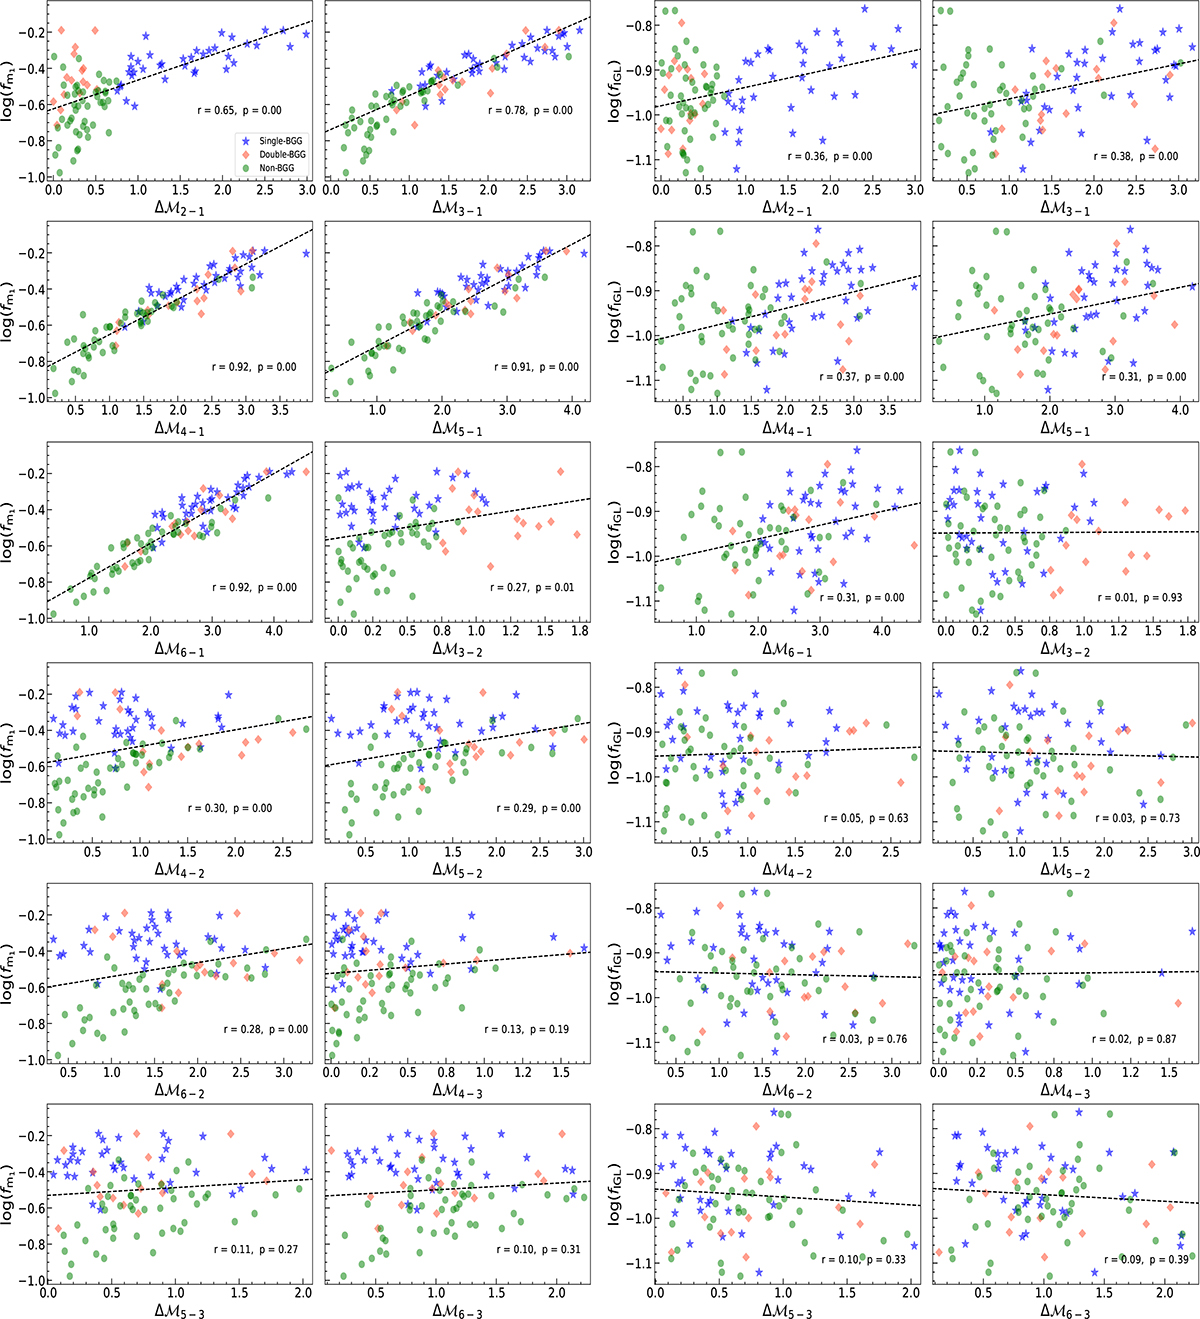
Relations between the logarithm of the mass fractions in m1 (two left columns) and the IGL (two right columns) at the end of the simulations and various magnitude gaps defined from the first six ranked galaxies in the groups. Each panel displays the Pearson r coefficient and associated p-value, with dotted black lines indicating the best linear fit. Weak or statistically insignificant linear correlations should not be taken as evidence of a physical link. The colours and shapes of data points identifying group classes follow the same scheme used in Fig. 2.
Current usage metrics show cumulative count of Article Views (full-text article views including HTML views, PDF and ePub downloads, according to the available data) and Abstracts Views on Vision4Press platform.
Data correspond to usage on the plateform after 2015. The current usage metrics is available 48-96 hours after online publication and is updated daily on week days.
Initial download of the metrics may take a while.