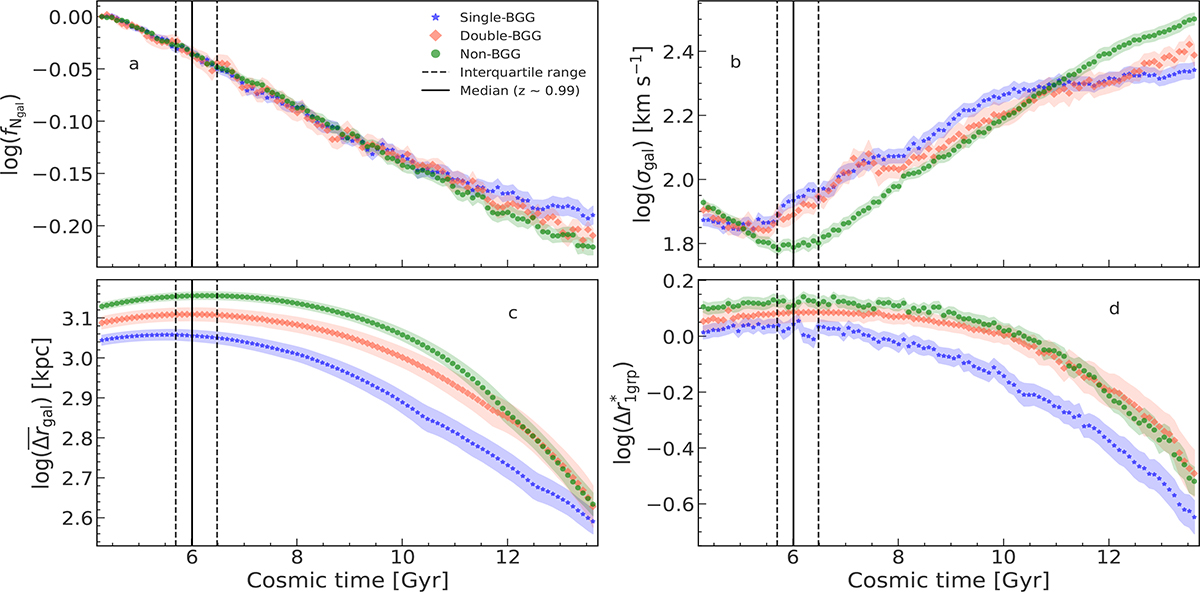
Fig. 3.
Download original image
Evolution in the last ∼9.3 Gyr of the runs of various indicators of dynamical state, shown separately for each group class: (a) the fraction of surviving group galaxies relative to Ngal(zref); (b) the mass-weighted velocity dispersion of group galaxies; (c) the mass-weighted mean pairwise spatial separation among group members; and (d) the offset between the first-ranked galaxy and the group’s centre of mass, expressed in units of the expected group virial radius (Eq. (9)). Data points represent the mean values for each class, with the associated transparent shaded bands surrounding them indicating the standard error. The vertical solid and dashed lines in the panels mark, respectively, the Q2, Q1 and Q3 quartiles of the distribution of turnaround times. Group classes are colour-coded as follows: single-BGG systems (blue), double-BGG systems (orange), and non-BGG systems (green).
Current usage metrics show cumulative count of Article Views (full-text article views including HTML views, PDF and ePub downloads, according to the available data) and Abstracts Views on Vision4Press platform.
Data correspond to usage on the plateform after 2015. The current usage metrics is available 48-96 hours after online publication and is updated daily on week days.
Initial download of the metrics may take a while.