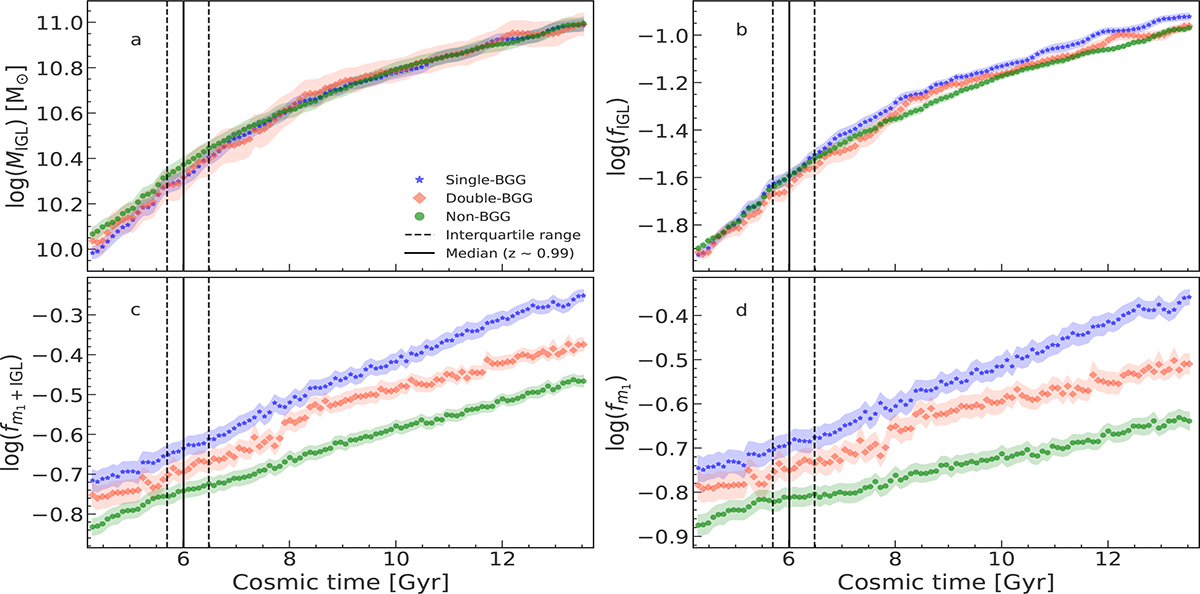
Fig. 4.
Download original image
Temporal evolution of various dynamical state indicators based on the IGL, shown separately for each group class: (a) the total IGL mass; (b) the IGL mass fraction; (c) the m1 plus total IGL mass fraction; and (d) the m1 mass fraction. All luminous mass fractions are expressed relative to the invariant total stellar mass of the groups. Data points represent the mean values for each class, with the associated transparent shaded bands surrounding them indicating the standard error. The central vertical solid and dashed left and right lines in the panels mark, respectively, the Q2, Q1 and Q3 quartiles of the distribution of turnaround times for the entire group sample. Group classes are colour-coded as in Fig. 3.
Current usage metrics show cumulative count of Article Views (full-text article views including HTML views, PDF and ePub downloads, according to the available data) and Abstracts Views on Vision4Press platform.
Data correspond to usage on the plateform after 2015. The current usage metrics is available 48-96 hours after online publication and is updated daily on week days.
Initial download of the metrics may take a while.