Fig. 5.
Download original image
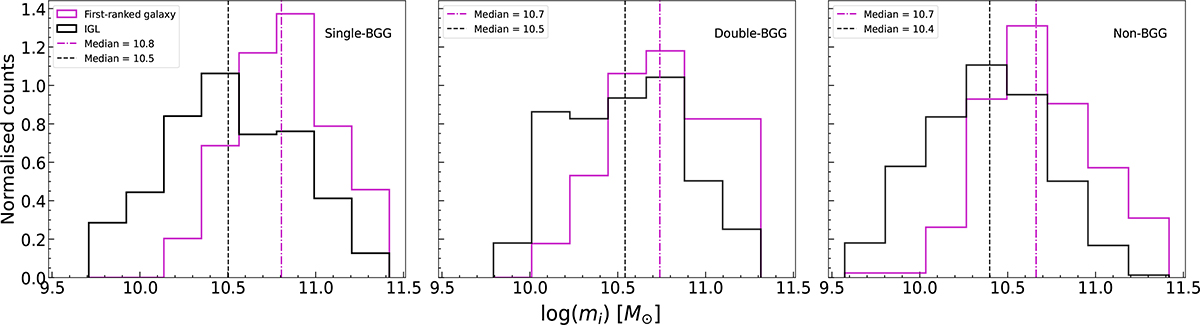
Histograms showing the luminous mass distribution of precursor galaxies at zini = 3 that contribute at least 5% to the final mass of either the first-ranked group galaxy m1 (solid magenta lines) or the IGL (solid black lines), with median values indicated by vertical dot-dashed and dashed lines, respectively. The distributions are shown separately for each group class: single-BGG (left), double-BGG (middle), and non-BGG (right) panels.
Current usage metrics show cumulative count of Article Views (full-text article views including HTML views, PDF and ePub downloads, according to the available data) and Abstracts Views on Vision4Press platform.
Data correspond to usage on the plateform after 2015. The current usage metrics is available 48-96 hours after online publication and is updated daily on week days.
Initial download of the metrics may take a while.