Fig. 6.
Download original image
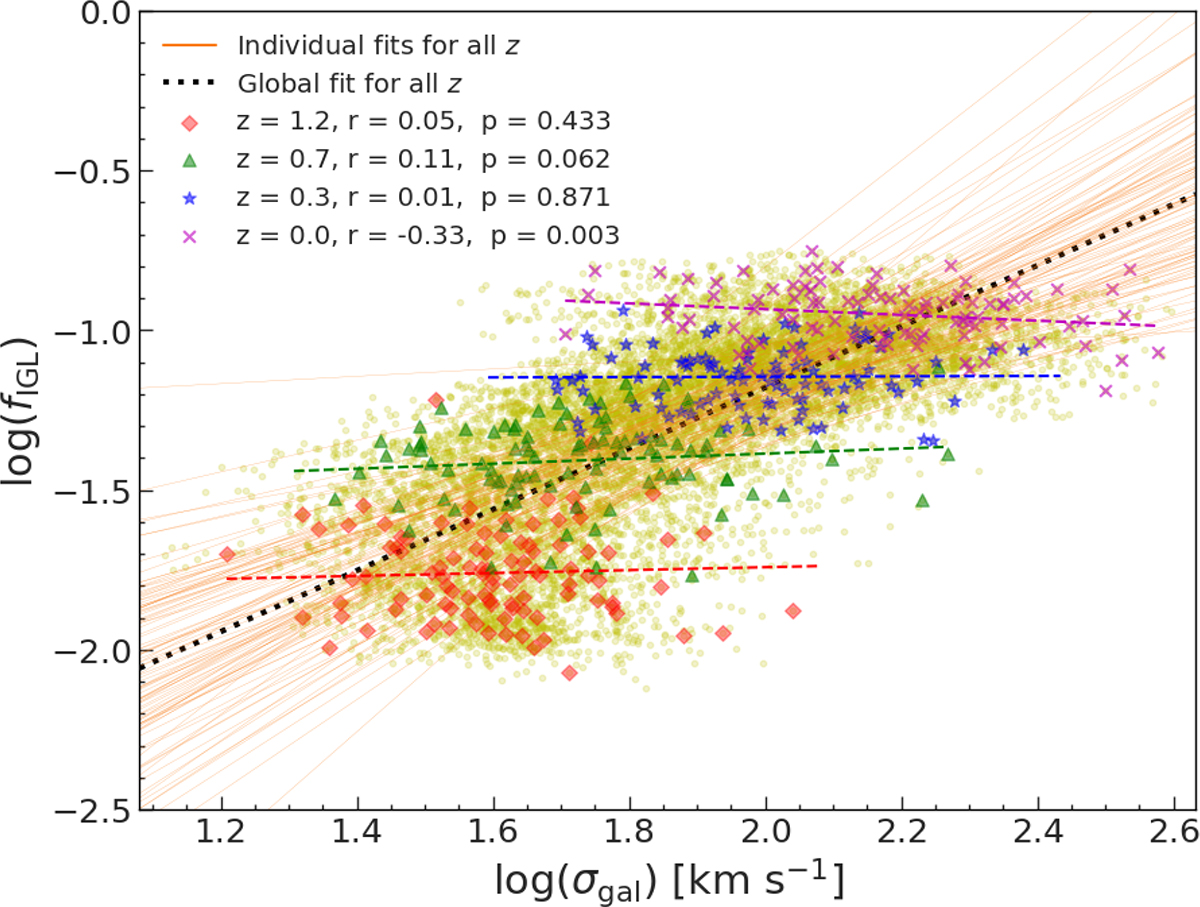
Temporal evolution of the relationship between the IGL mass fraction, fIGL(t), and the mass-weighted velocity dispersion of group galaxies, σgal(t). Thin solid orange lines represent linear fits to the secular evolution of these quantities in individual groups, while the dotted black line shows the global trend. Dashed lines indicate the best linear fits of this relationship at four specific redshifts: z = 1.2 (red, diamonds), z = 0.7 (green, triangles), z = 0.3 (blue, stars), and z = 0 (purple, crosses), with line colours matching the corresponding data symbols. Each cosmic epoch-specific fit is annotated with its Pearson r correlation coefficient and p-value. For clarity, only data corresponding to the projection onto the XY plane are displayed, although the reported fit statistics take into account all three Cartesian projections.
Current usage metrics show cumulative count of Article Views (full-text article views including HTML views, PDF and ePub downloads, according to the available data) and Abstracts Views on Vision4Press platform.
Data correspond to usage on the plateform after 2015. The current usage metrics is available 48-96 hours after online publication and is updated daily on week days.
Initial download of the metrics may take a while.