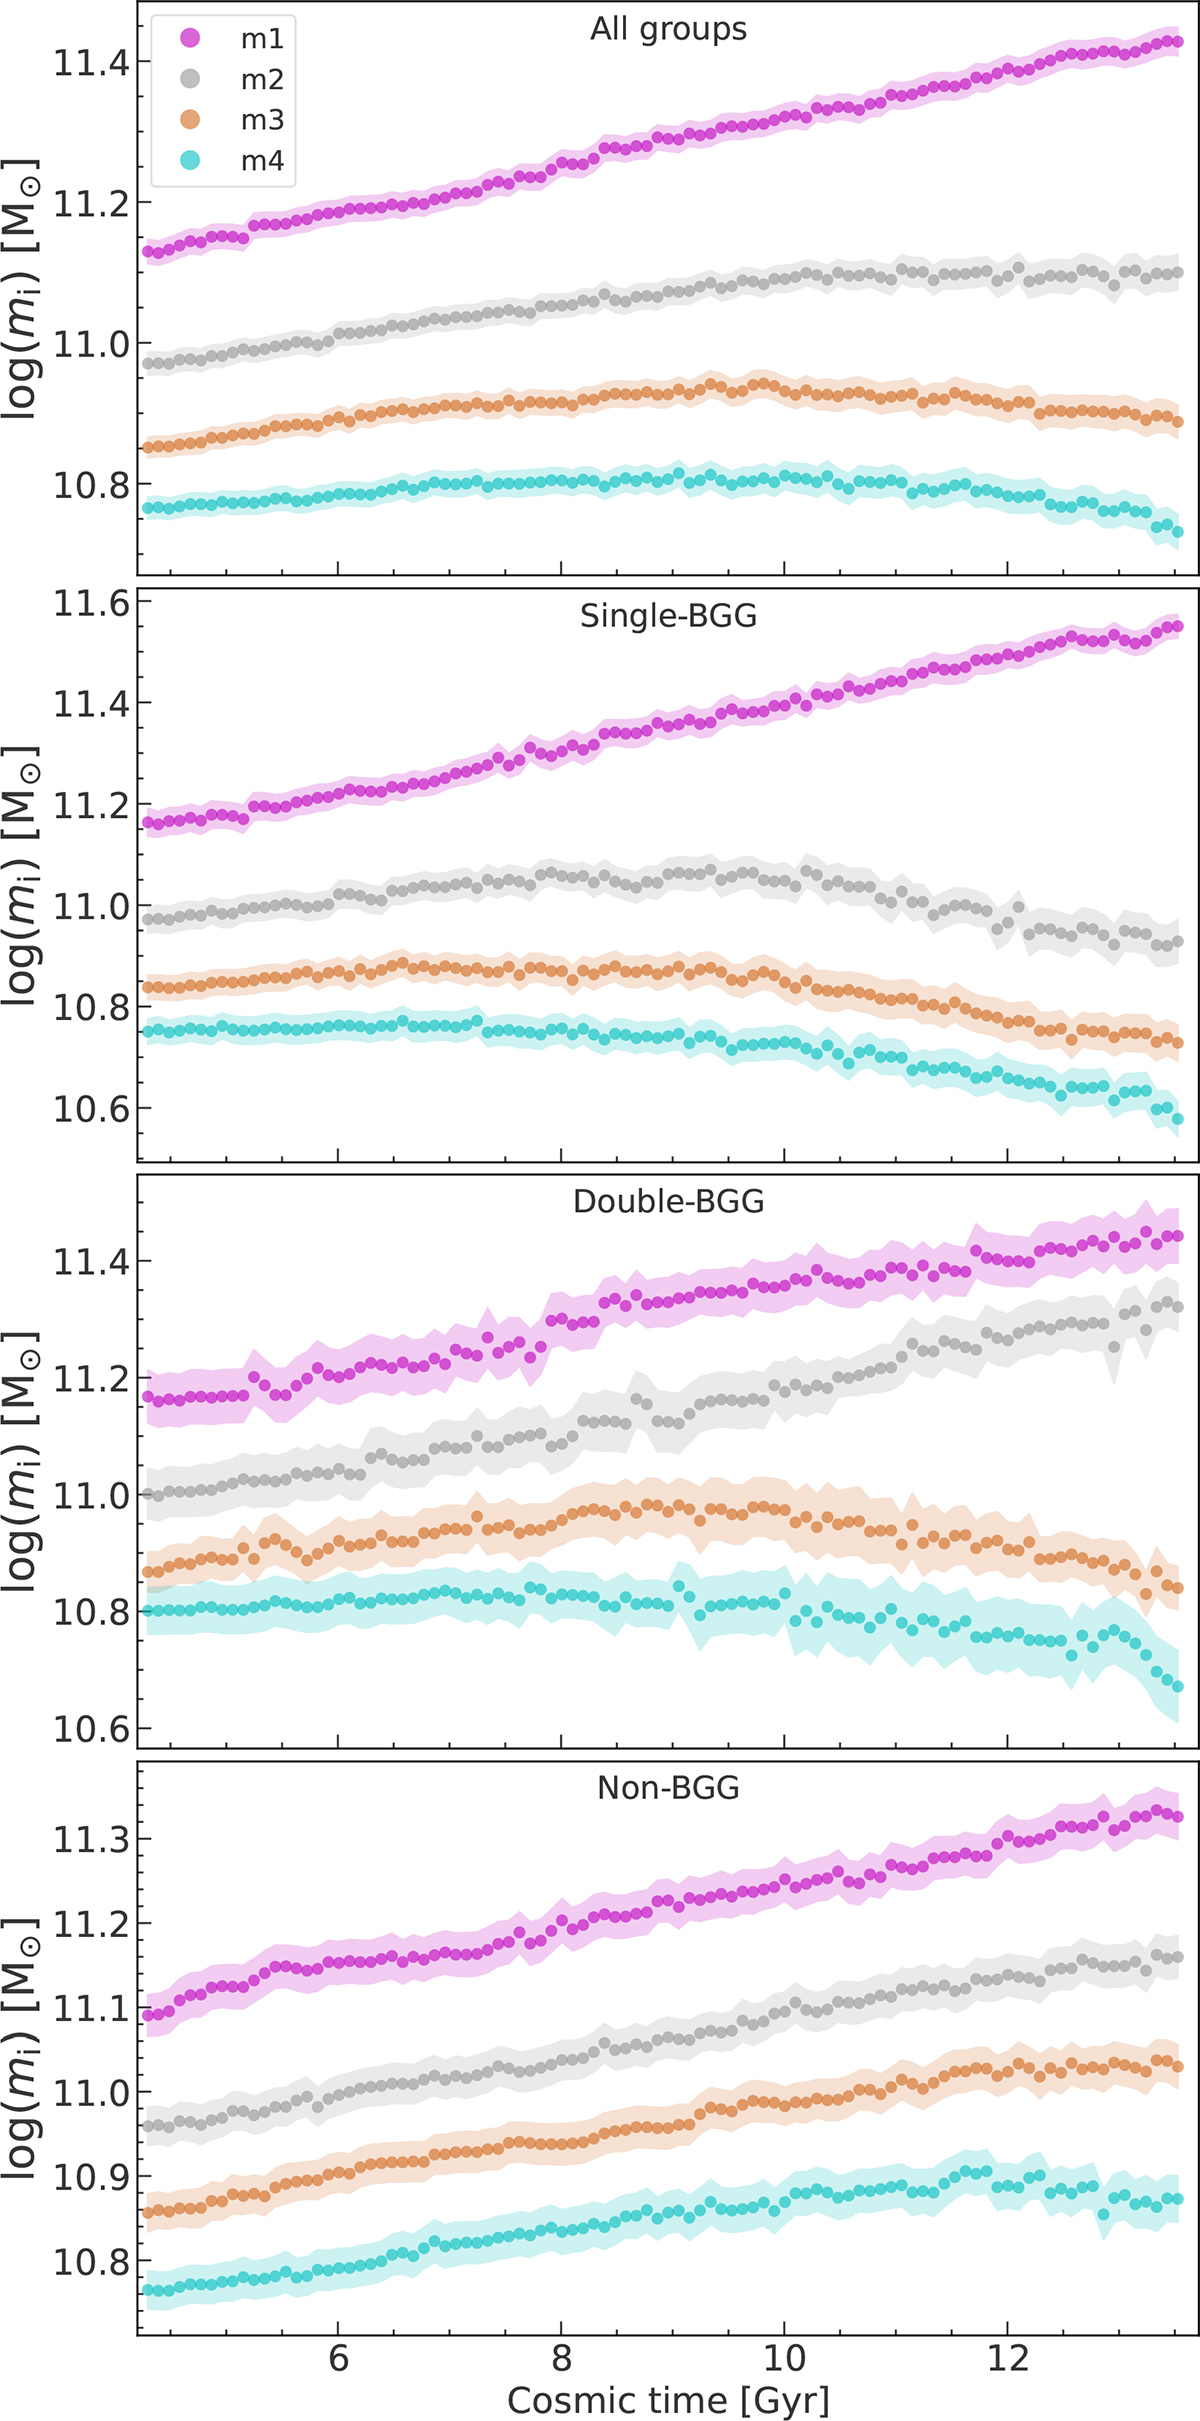
Fig. 8.
Download original image
Temporal evolution of the average stellar mass of the four most massive (brightest) galaxies identified in each of our galaxy groups. From top to bottom, panels correspond to all groups: combined, single-BGG groups, double-BGG groups, and non-BGG groups. Data points represent the mean stellar mass of m1 (magenta), m2 (grey), m3 (brown), and m4 (cyan) galaxies, with the associated shaded regions indicating the standard error.
Current usage metrics show cumulative count of Article Views (full-text article views including HTML views, PDF and ePub downloads, according to the available data) and Abstracts Views on Vision4Press platform.
Data correspond to usage on the plateform after 2015. The current usage metrics is available 48-96 hours after online publication and is updated daily on week days.
Initial download of the metrics may take a while.