Fig. 1.
Download original image
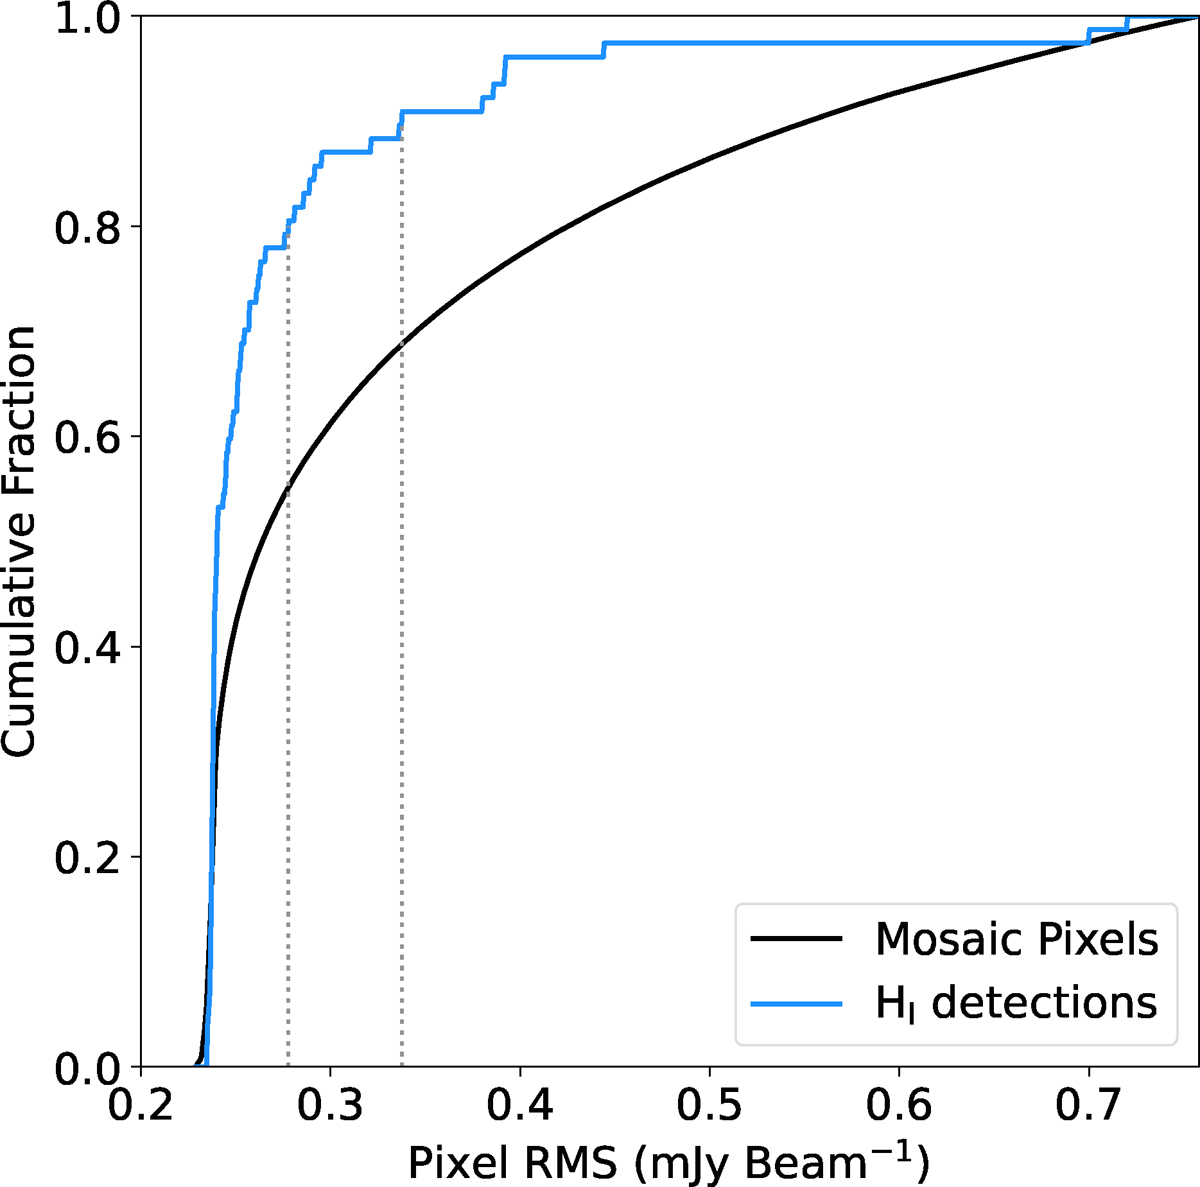
Cumulative histogram of the RMS values. The black and blue histograms show the cumulative distribution of the median pixel value, measured along the line of sight in the mosaic, and the RMS at the location of each H I-detection. The dotted grey lines at 0.28 and 0.34 mJy beam−1 show the 80th and 90th percentiles of the cumulative distribution of H I detections, respectively. The overwhelming majority of H I detections are near the minimum RMS of the mosaic with only a small variation.
Current usage metrics show cumulative count of Article Views (full-text article views including HTML views, PDF and ePub downloads, according to the available data) and Abstracts Views on Vision4Press platform.
Data correspond to usage on the plateform after 2015. The current usage metrics is available 48-96 hours after online publication and is updated daily on week days.
Initial download of the metrics may take a while.