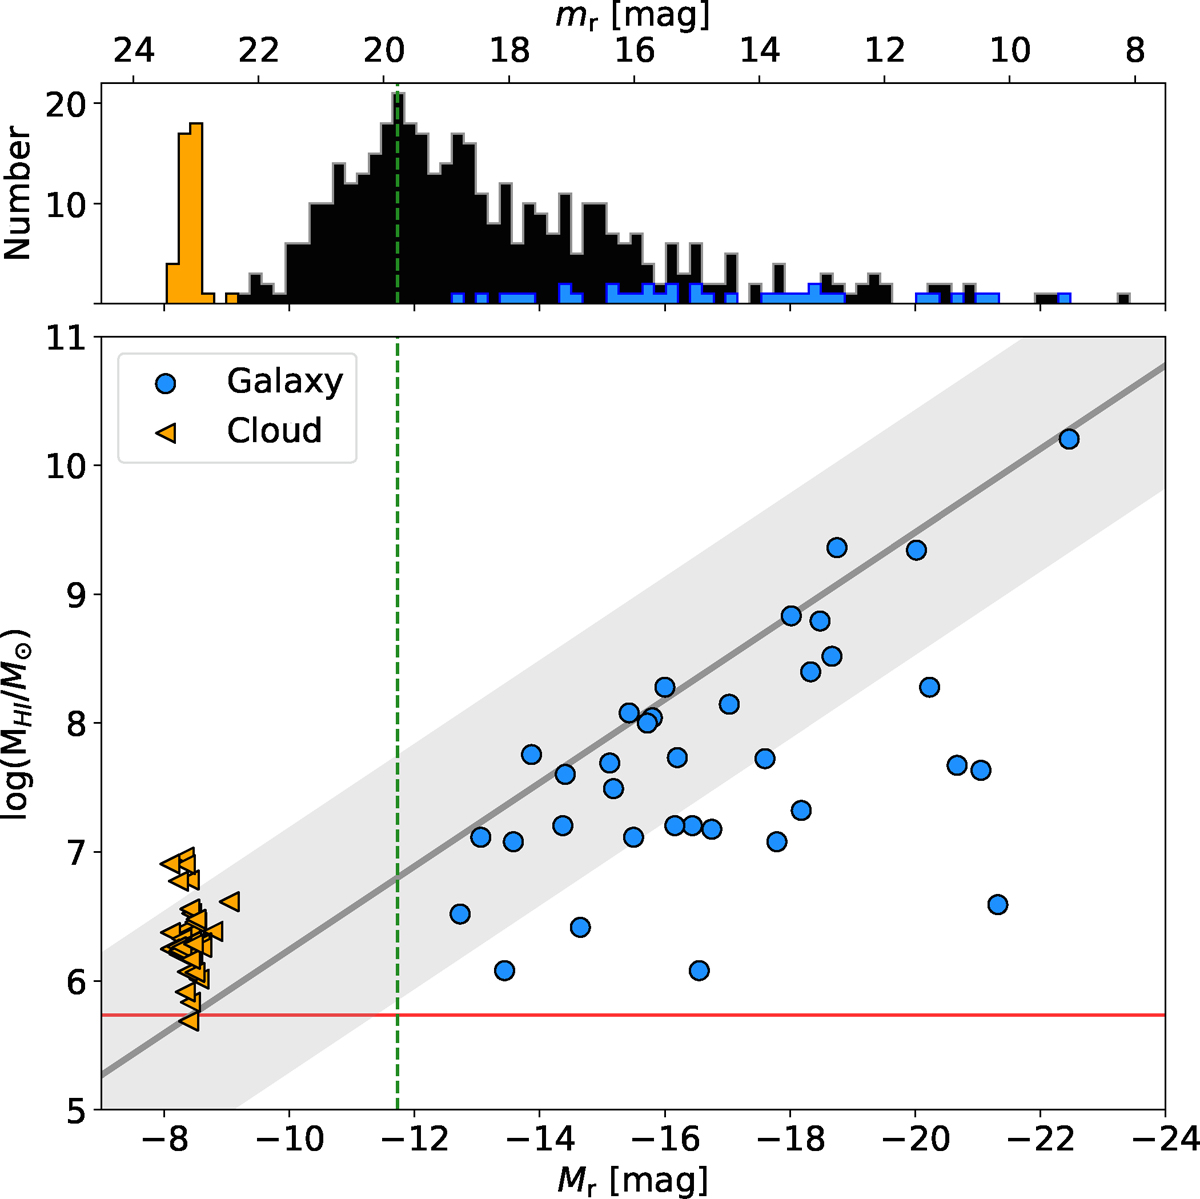
Fig. 2.
Download original image
Mr − MHI plane. The main figure shows galaxies detected in H I as blue-filled circles, and the H I cloud 5σ optical flux upper limits are shown with orange left-pointing arrows. The grey line and shaded region is the mean and scatter of the scaling relation of CVn galaxies (Kovač et al. 2009); the solid red line represents the lowest MHI detection limit of the mosaic, and the dashed green line at Mr = −11.7 denotes the completeness limit of the FDS catalogue. Top panel: Absolute and apparent r-band histogram of all cluster galaxies (black), H I-detected galaxies (blue), and the optical flux 5σ upper limits of the H I clouds (orange). The H I-detected galaxies and clouds are clearly two distinct populations.
Current usage metrics show cumulative count of Article Views (full-text article views including HTML views, PDF and ePub downloads, according to the available data) and Abstracts Views on Vision4Press platform.
Data correspond to usage on the plateform after 2015. The current usage metrics is available 48-96 hours after online publication and is updated daily on week days.
Initial download of the metrics may take a while.