Fig. 3.
Download original image
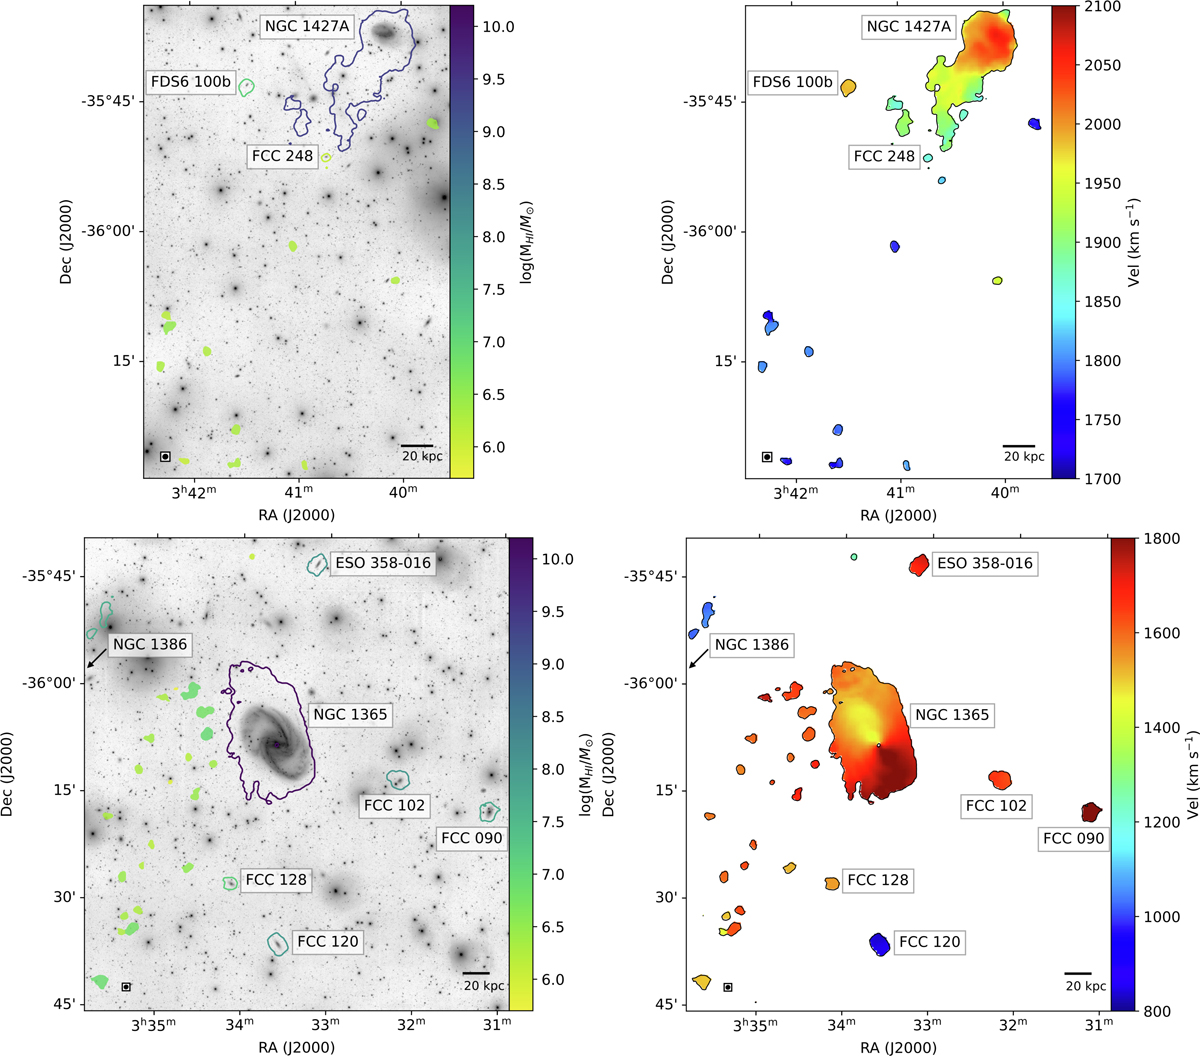
Optical, H I emission and velocity field of NGC 1427A (top) and NGC 1365 (bottom). Left: FDS g-band image with the 3σNHI, 25 km s−1 = 2.7 × 1018 cm−2 contour overlaid. The H I-detections are coloured according to their integrated MHI, where galaxies are labelled and shown with open contours and H I clouds are filled. Right: Velocity of the respective fields. In all images, the 43″ × 40″ beam is shown in the bottom left, and a 20 kpc scale bar is shown on the bottom right. With respect to NGC 1427A and NGC 1365, the H I clouds have similar velocities and show a continuous gradient.
Current usage metrics show cumulative count of Article Views (full-text article views including HTML views, PDF and ePub downloads, according to the available data) and Abstracts Views on Vision4Press platform.
Data correspond to usage on the plateform after 2015. The current usage metrics is available 48-96 hours after online publication and is updated daily on week days.
Initial download of the metrics may take a while.