Fig. 4.
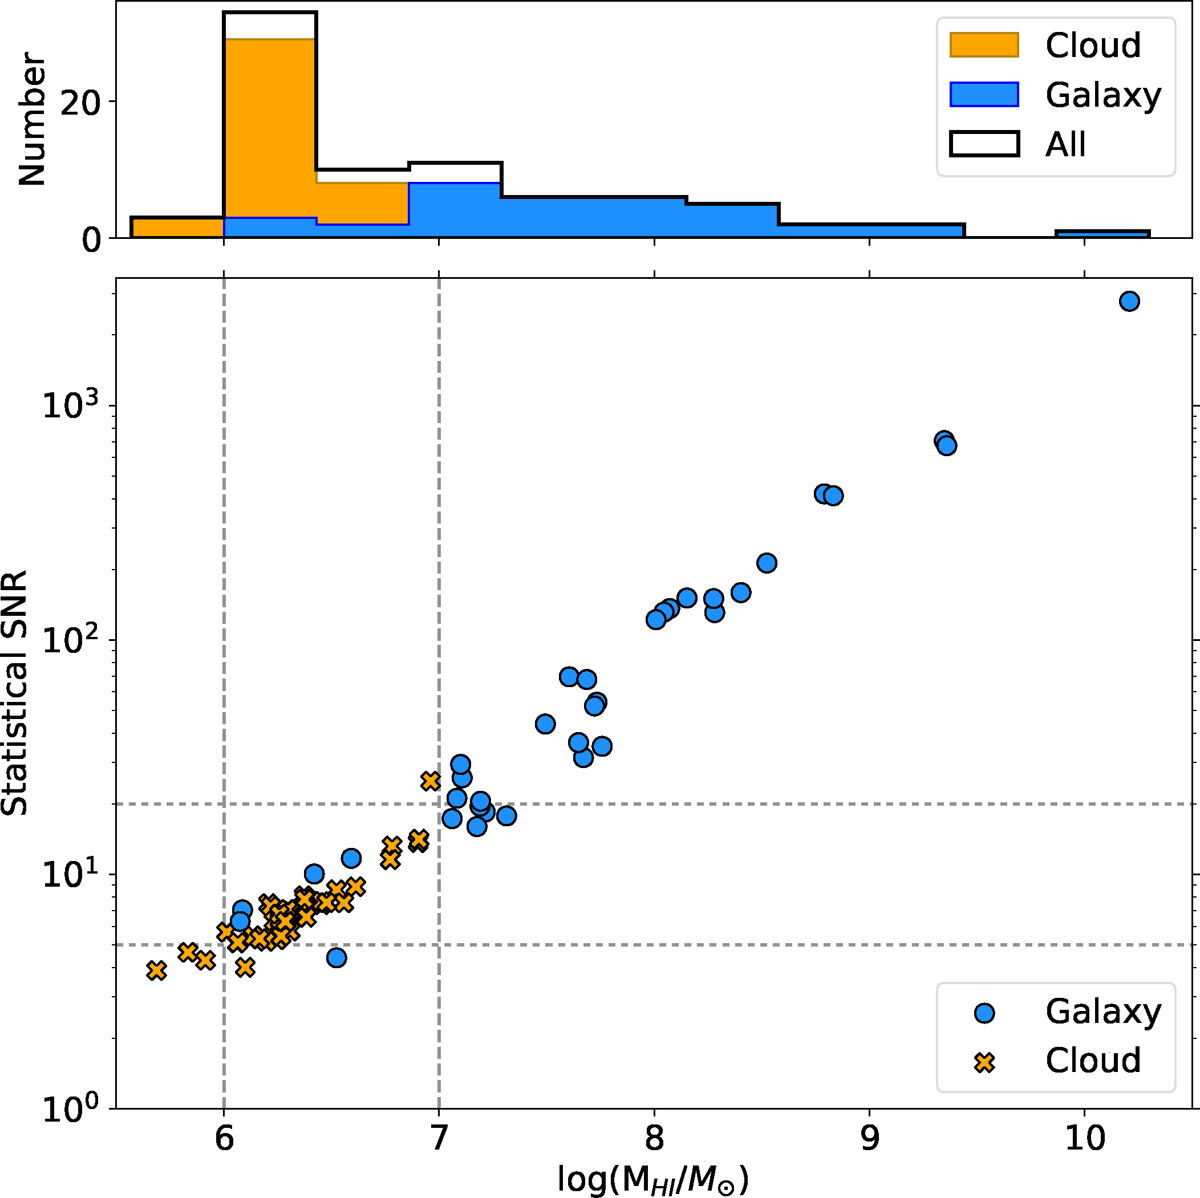
Download original image
The MHI and statistical S/N. In the main panel, the blue points and orange crosses show the H I-detected galaxies and clouds, respectively. Dashed lines have been placed at log(MHI M⊙) = 6 and 7, and S/N = 5 and 20. The top panel shows the number of detections for all H I-sources (black) and the galaxies and clouds using the same colours as the main panel. The top panel shows a severe truncation of H I-detected galaxies at log(MHI/M⊙) = 7, where the typical statistical S/N is 20.
Current usage metrics show cumulative count of Article Views (full-text article views including HTML views, PDF and ePub downloads, according to the available data) and Abstracts Views on Vision4Press platform.
Data correspond to usage on the plateform after 2015. The current usage metrics is available 48-96 hours after online publication and is updated daily on week days.
Initial download of the metrics may take a while.