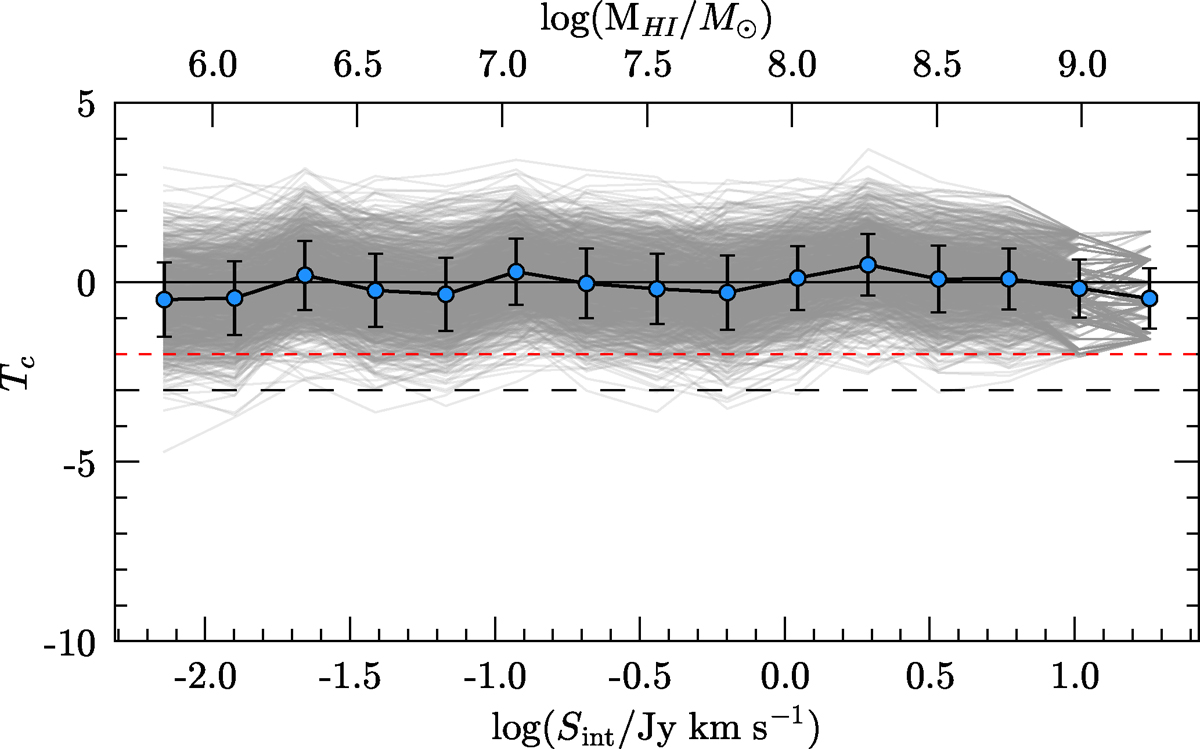
Fig. 5.
Download original image
Modified Rauzy test. The Rauzy completeness statistic (Tc) is shown as a function of the integrated flux. The blue points represent ⟨Tc⟩ from 1000 runs varying the line-of-sight distance of each detection within 3Rvir of the Fornax cluster. The uncertainties are computed as the variance, and the grey lines show each individual test. The short-dashed red and long-dashed black lines represent the 97.7% (Tc = −2) and 99.4% (Tc = −3) confidence intervals, respectively.
Current usage metrics show cumulative count of Article Views (full-text article views including HTML views, PDF and ePub downloads, according to the available data) and Abstracts Views on Vision4Press platform.
Data correspond to usage on the plateform after 2015. The current usage metrics is available 48-96 hours after online publication and is updated daily on week days.
Initial download of the metrics may take a while.