Fig. 6.
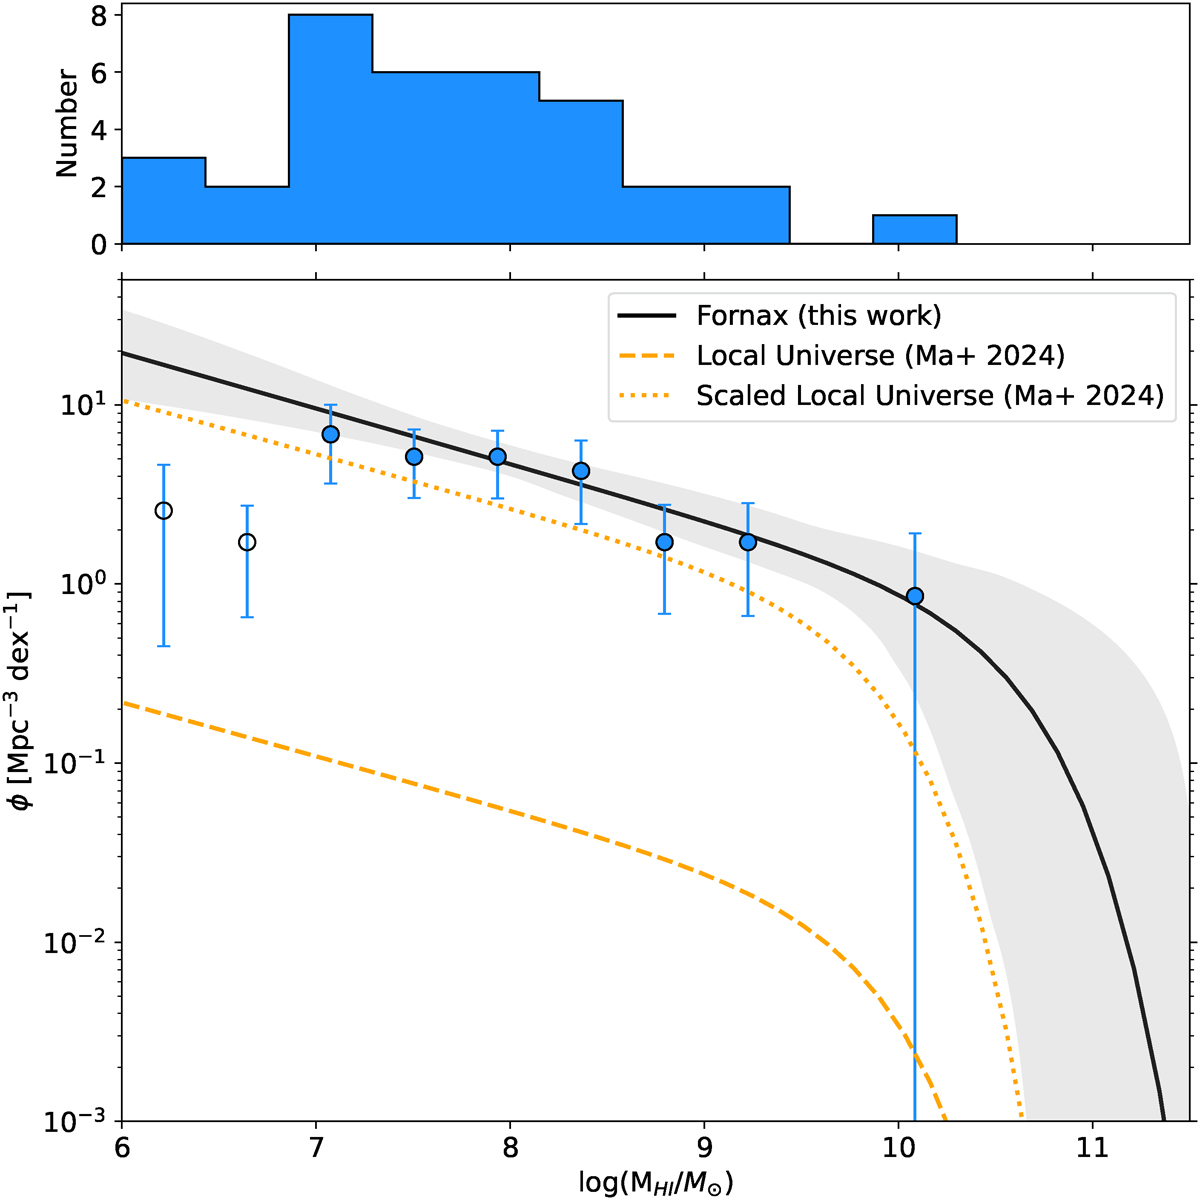
Download original image
Fornax Cluster H IMF. In the main figure, the circles represent the observed number density (ϕ) from the binned data (for display purposes) with their respective Poisson uncertainties. The filled circles represent galaxies in the MHI range used to fit the H IMF, log(MHI/M⊙) ≥ 7, while the open circles represent galaxies in the MHI range excluded from the fit due to their obvious departure from a power law. The black line is the MML fit and the grey-shaded region denotes the 1σ uncertainty of the fit. A volume of 2.7 Mpc3 was assumed for the fitting procedure. The dashed orange line indicates the H IMF of the local Universe (Ma et al. 2025), and the dotted orange line indicates the local Universe H IMF, scaled by using the Fornax ϕ*. Top panel: Histogram of the H I-detected galaxies.
Current usage metrics show cumulative count of Article Views (full-text article views including HTML views, PDF and ePub downloads, according to the available data) and Abstracts Views on Vision4Press platform.
Data correspond to usage on the plateform after 2015. The current usage metrics is available 48-96 hours after online publication and is updated daily on week days.
Initial download of the metrics may take a while.