Fig. 5
Download original image
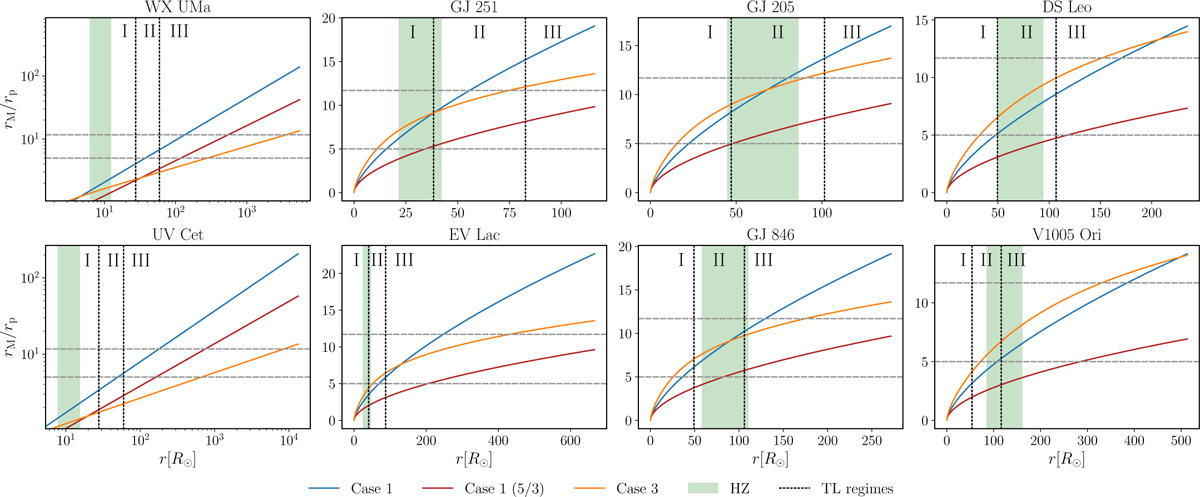
Magnetopause distance as a function of the stellar radius of representative stars from our sample. The blue and orange lines represent Case 1 (only stellar magnetic pressure is considered) and Case 3 (stellar magnetic and ram pressures are considered) with slow wind, respectively. The red line is Case 1 with the alternative magnetic field decay Br ∝ r−5/3. The solid green area is the HZ of the star. The gray horizontal dashed lines indicate the size of the magnetosphere of early (5rp) and modern Earth (11.7rp). The black vertical dotted lines represent the different tidal locking regimes assuming Q = 100 (see Section 3.2).
Current usage metrics show cumulative count of Article Views (full-text article views including HTML views, PDF and ePub downloads, according to the available data) and Abstracts Views on Vision4Press platform.
Data correspond to usage on the plateform after 2015. The current usage metrics is available 48-96 hours after online publication and is updated daily on week days.
Initial download of the metrics may take a while.