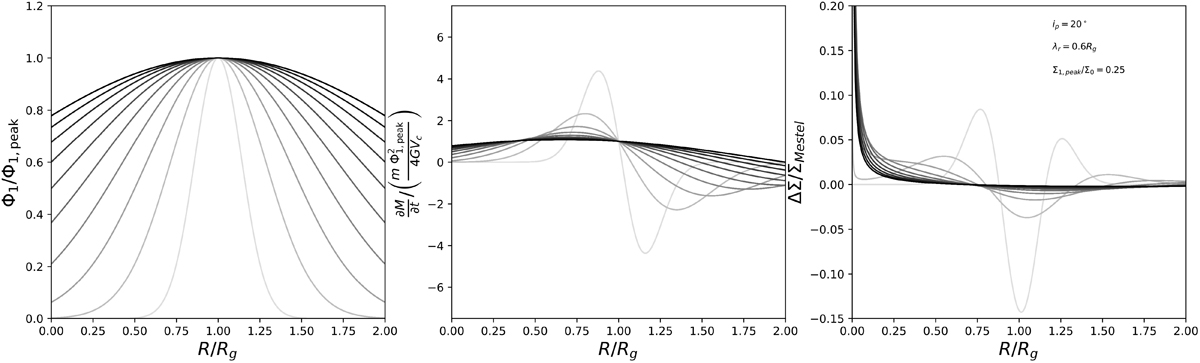
Fig. 2.
Download original image
Illustration of the changes to radial profiles of disk mass (middle) and surface density (right) due to ten transient spiral waves (left) after one dynamical time. The spiral potentials in the leftmost panel are modeled as Gaussians centered on radius Rg with width ΔRg. The gray scale of each line varies with ΔRg, from low (light gray) to high (black). The narrowest of these represents the growth in the adiabatic limit, while progressively larger ΔRg illustrate the result of near-resonant, nonadiabatic growth. Each potential is used to calculate Cg according to Eq. (45). The mass and surface density evolution is calculated according to Eqs. (48) and (51), respectively. The adopted spiral properties are shown in the legend in the rightmost panel.
Current usage metrics show cumulative count of Article Views (full-text article views including HTML views, PDF and ePub downloads, according to the available data) and Abstracts Views on Vision4Press platform.
Data correspond to usage on the plateform after 2015. The current usage metrics is available 48-96 hours after online publication and is updated daily on week days.
Initial download of the metrics may take a while.