Fig. 10
Download original image
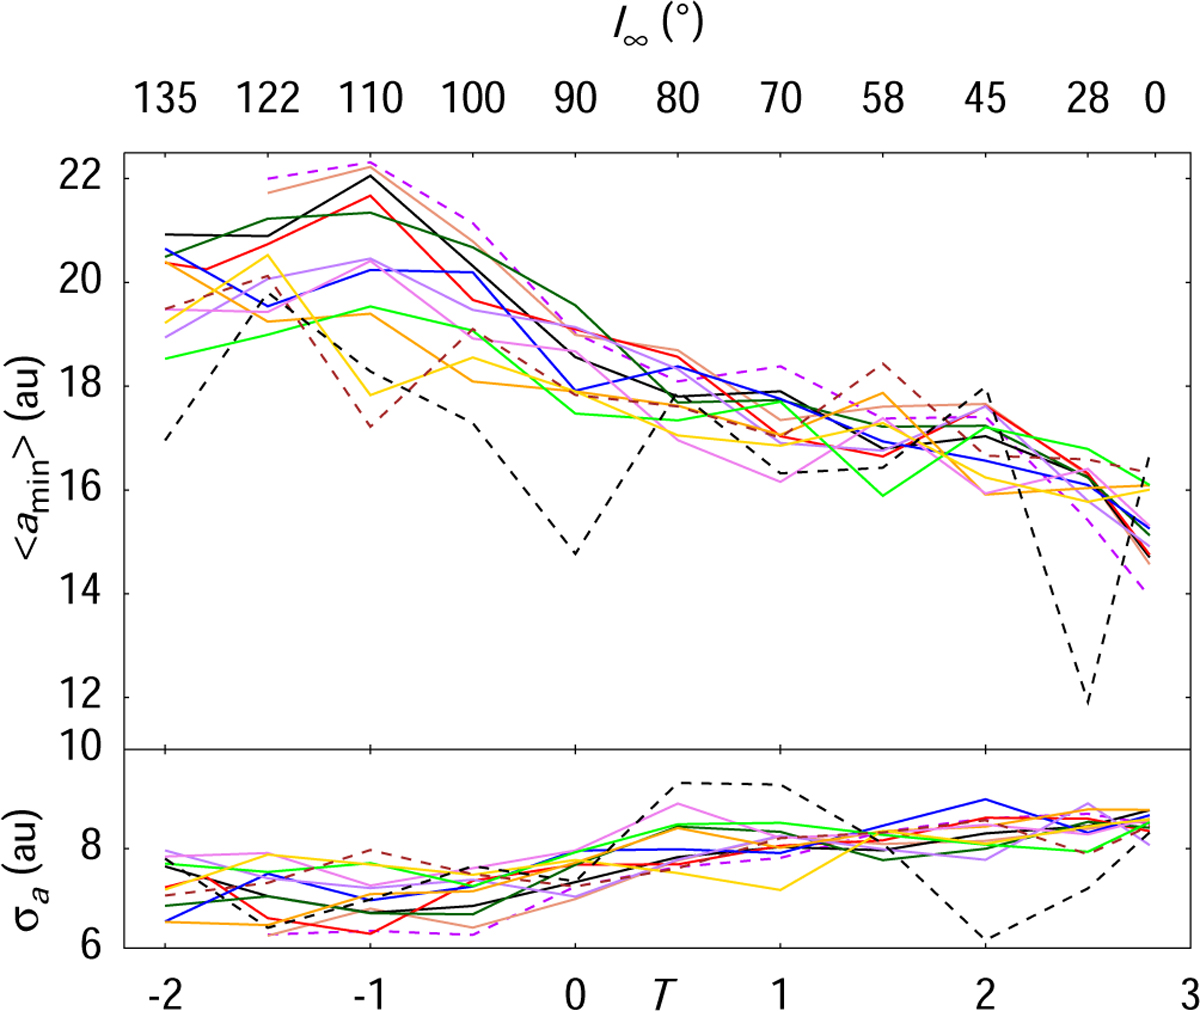
Centaur minimum semimajor axis of initially hot TNOs as a function of T (and I∞) for semimajor axes 50 ≤ a (au) ≤ 140 (solid curves) inside the stable region, and a = 40, 200, 500 au (dashed curves) outside the stable region. The color codes are those of Figs. 3 and 5. The average semimajor axis, ⟨amin⟩, and standard deviation, σa, are shown in the top and bottom panels, respectively.
Current usage metrics show cumulative count of Article Views (full-text article views including HTML views, PDF and ePub downloads, according to the available data) and Abstracts Views on Vision4Press platform.
Data correspond to usage on the plateform after 2015. The current usage metrics is available 48-96 hours after online publication and is updated daily on week days.
Initial download of the metrics may take a while.