Open Access
Fig. 13
Download original image
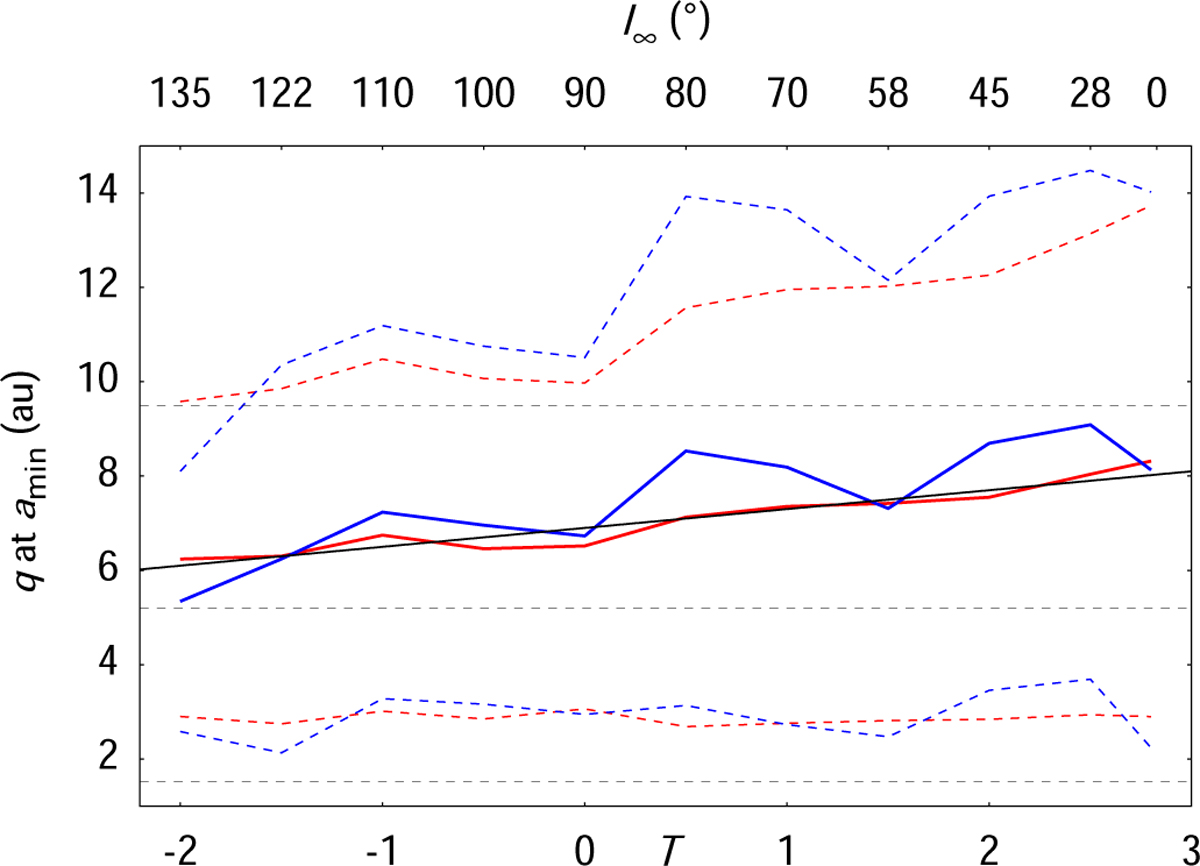
Average Centaur perihelion at minimum semimajor axis of cold TNOs (blue) and hot TNOs (red) as a function of T (and I∞). Dashed blue and red curves are the corresponding standard deviations. The solid black line is ⟨q⟩ (au) = 6.9 + 0.4T. The planets’ positions are indicated with dashed black lines.
Current usage metrics show cumulative count of Article Views (full-text article views including HTML views, PDF and ePub downloads, according to the available data) and Abstracts Views on Vision4Press platform.
Data correspond to usage on the plateform after 2015. The current usage metrics is available 48-96 hours after online publication and is updated daily on week days.
Initial download of the metrics may take a while.