Fig. 2
Download original image
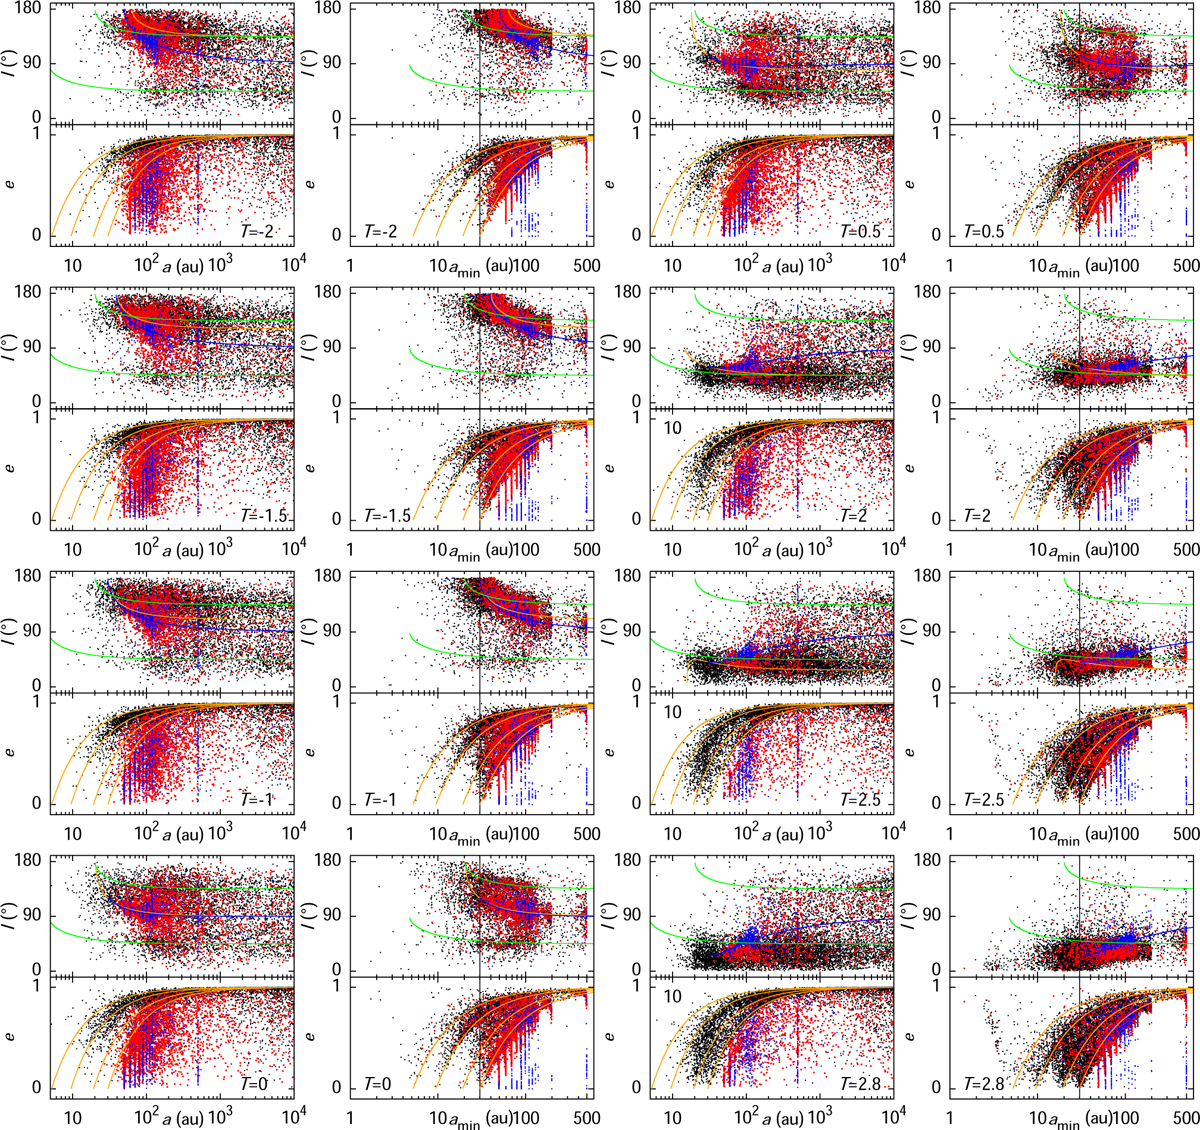
TNO reservoirs at 4.5 Gyr for different Tisserand parameters, T. Hot TNOs are shown in red and cold TNOs in blue. Unstable TNOs are shown in black at the last sampling epoch before instability. The first and third columns display the orbital distributions in the (a, I) and (a, e) planes. The second and fourth columns show I, e, and a at minimum semimajor axis, where a vertical black line denotes Neptune’s semimajor axis. The solid orange and blue curves in the inclination panels are, respectively, the Tisserand inclination pathway ITiss(a, T, aN) (2) and the circular orbits’ initial inclination, Icirc(a, T, aN) (5), with respect to Neptune. The solid green curves for retrograde and prograde inclinations respectively are the Tisserand inclinations pathways with respect to Saturn ITiss(a, −2, aS) (135° inclination) and ITiss(a, 2, aS) (45° inclination). In the eccentricity panels, the curves indicate perihelia that match the four giant planets’ semimajor axes. The Tisserand inclination pathway with respect to Neptune is not shown for T = 2.8 because expression (2) is not valid for T > 2.7 (see Paper III for details).
Current usage metrics show cumulative count of Article Views (full-text article views including HTML views, PDF and ePub downloads, according to the available data) and Abstracts Views on Vision4Press platform.
Data correspond to usage on the plateform after 2015. The current usage metrics is available 48-96 hours after online publication and is updated daily on week days.
Initial download of the metrics may take a while.