Fig. 11
Download original image
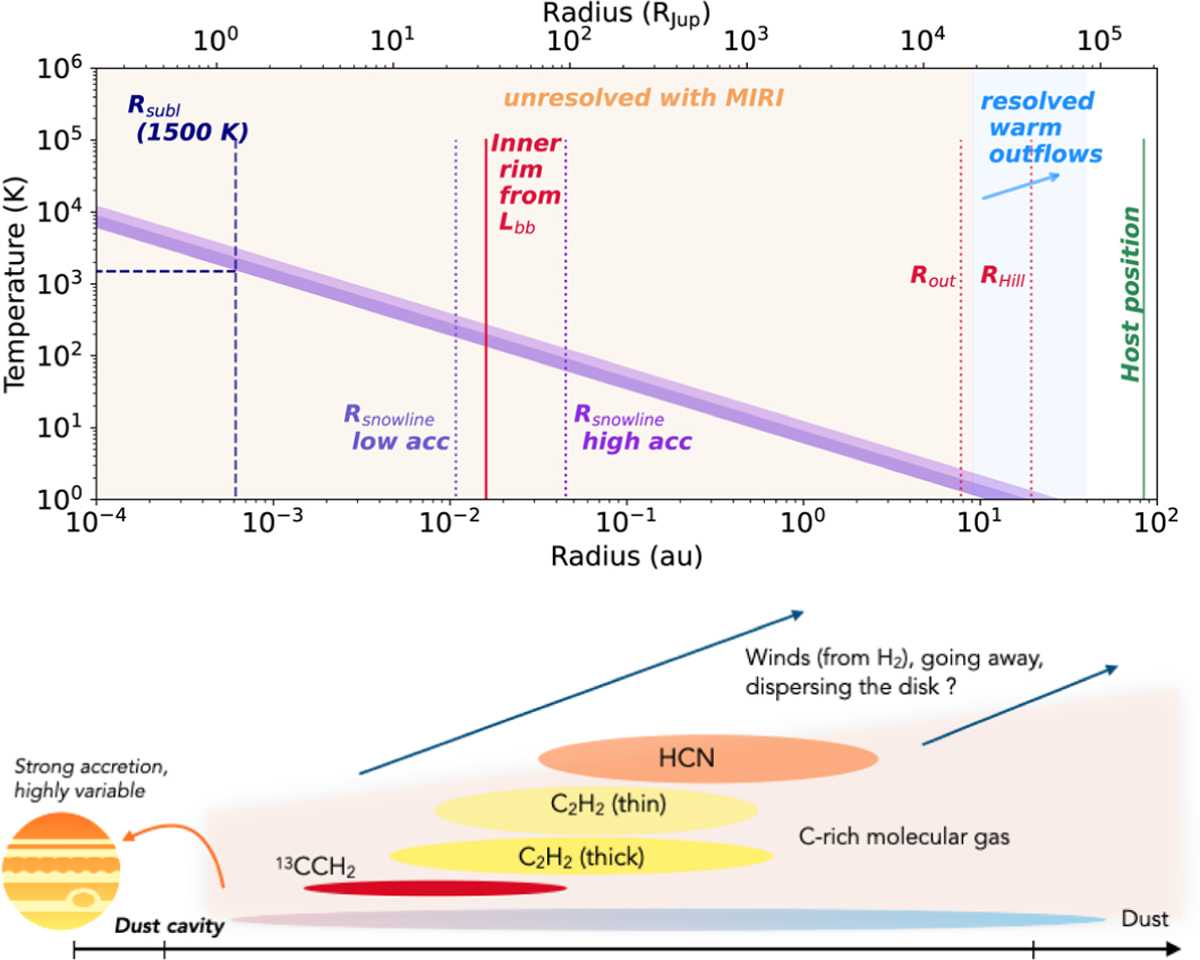
Schematic of the Delorme 1 AB b system: the planet and its CPD. Top: temperature as a function of radius with both axes on a logarithmic scale. The upper and lower purple bounds correspond to scenarios with high and low accretion, respectively. Representative radius values are indicated. The beige region denotes scales below the spatial resolution of MIRI/MRS. Bottom: illustration of the CPD structure with the molecular gas species, intended as a simplified representation; it does not necessarily reflect the true spatial distribution of molecular species.
Current usage metrics show cumulative count of Article Views (full-text article views including HTML views, PDF and ePub downloads, according to the available data) and Abstracts Views on Vision4Press platform.
Data correspond to usage on the plateform after 2015. The current usage metrics is available 48-96 hours after online publication and is updated daily on week days.
Initial download of the metrics may take a while.