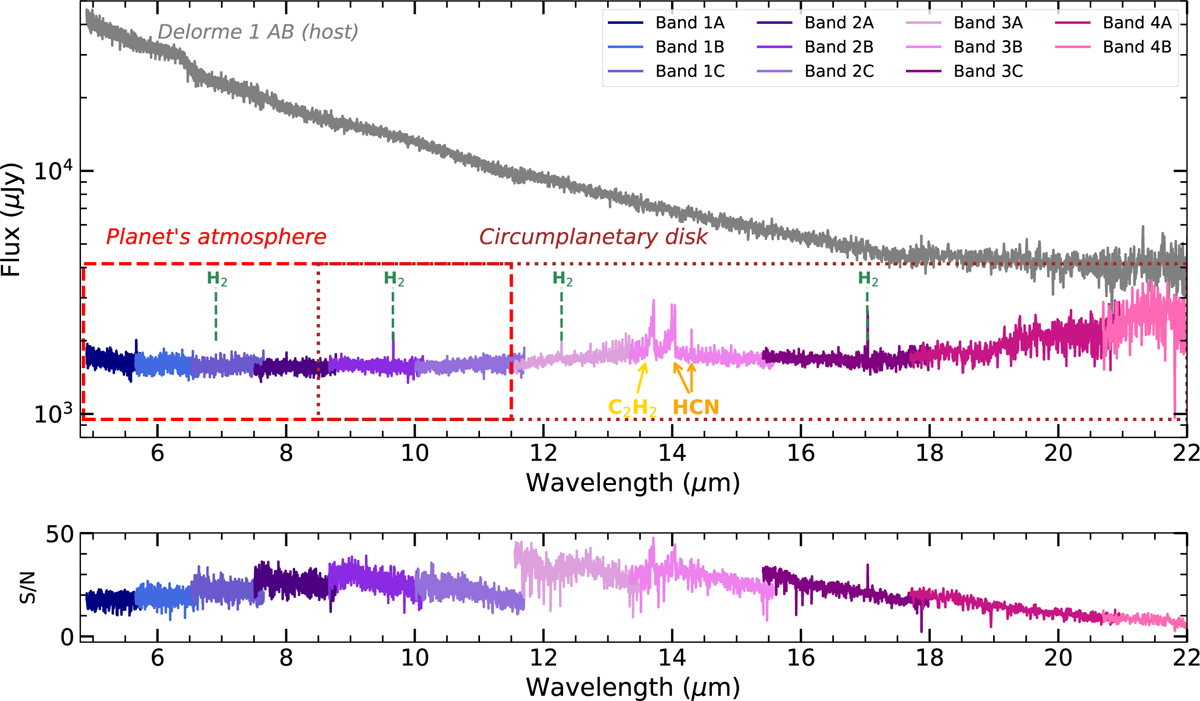
Fig. 2
Download original image
Top: extracted spectra of the binary star (shown in gray, with the highest flux) and its companion Delorme 1 AB b (color coded from blue to purple, the lowest flux) across the MIRI/MRS bands. The dashed region outlined in red indicates the wavelength range where the planet’s atmosphere is detected (see Fig. 4), while the brown, dotted region marks the wavelengths dominated by the circumplanetary disk. These regions are shown for reference purposes and should not be considered as an actual boundary between the planet’s atmospheric spectrum and the CPD. Molecular gases are shown for indicative purposes (see Figure 6 for detailed characterization). Bottom: S/N as a function of wavelength for the planetary-mass companion.
Current usage metrics show cumulative count of Article Views (full-text article views including HTML views, PDF and ePub downloads, according to the available data) and Abstracts Views on Vision4Press platform.
Data correspond to usage on the plateform after 2015. The current usage metrics is available 48-96 hours after online publication and is updated daily on week days.
Initial download of the metrics may take a while.