Open Access
Fig. B.1
Download original image
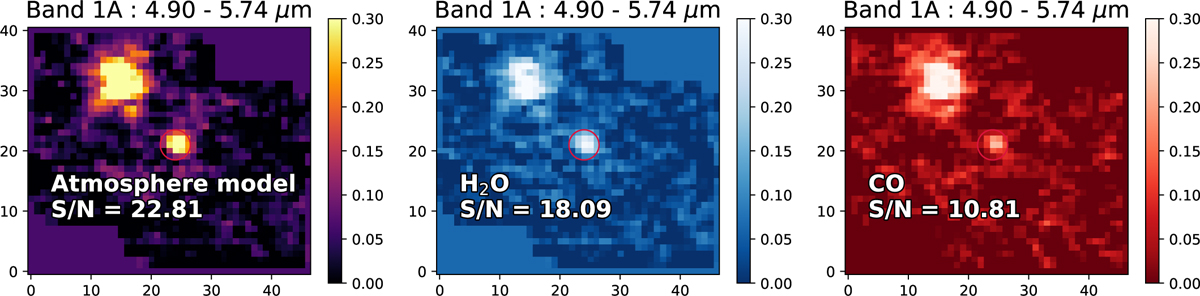
Correlation maps. The first panel (left) shows the cross correlation values for each pixel between the spaxel (pixel spectrum) and the Exo-REM best-fit model. The middle panel shows the correlation values with a template model spectrum of H2O only, while the right panel uses a CO model template.
Current usage metrics show cumulative count of Article Views (full-text article views including HTML views, PDF and ePub downloads, according to the available data) and Abstracts Views on Vision4Press platform.
Data correspond to usage on the plateform after 2015. The current usage metrics is available 48-96 hours after online publication and is updated daily on week days.
Initial download of the metrics may take a while.