Open Access
Fig. B.2
Download original image
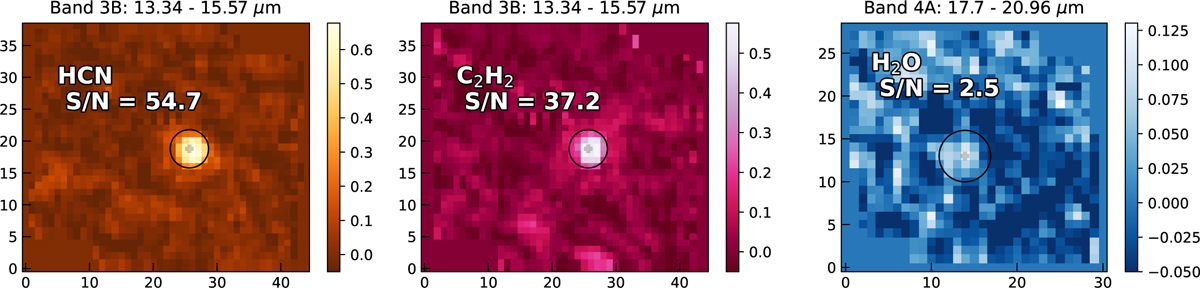
Correlation maps. The first two panels show the cross correlation values for each pixel between the spaxel and the hydrocarbon templates: HCN (left) and C2H2 (middle). The right panel shows the correlation map with a template of H2O in emission. The S/N values are displayed for the companion.
Current usage metrics show cumulative count of Article Views (full-text article views including HTML views, PDF and ePub downloads, according to the available data) and Abstracts Views on Vision4Press platform.
Data correspond to usage on the plateform after 2015. The current usage metrics is available 48-96 hours after online publication and is updated daily on week days.
Initial download of the metrics may take a while.