Open Access
Fig. D.1
Download original image
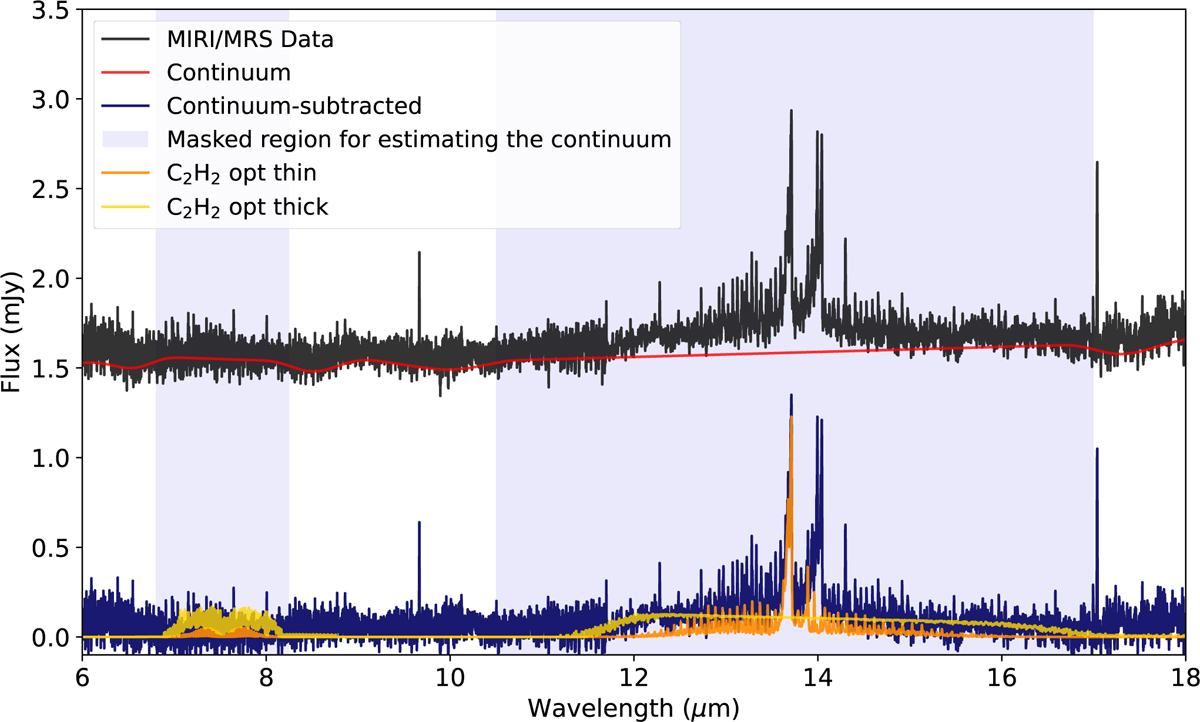
MIRI/MRS spectrum of Delorme 1 AB b in black, with the measured continuum overplotted in red. The lower panel shows the continuum-subtracted spectrum together with both C2H2 components. Inclusion of both components is required to reproduce the observed C2H2 feature.
Current usage metrics show cumulative count of Article Views (full-text article views including HTML views, PDF and ePub downloads, according to the available data) and Abstracts Views on Vision4Press platform.
Data correspond to usage on the plateform after 2015. The current usage metrics is available 48-96 hours after online publication and is updated daily on week days.
Initial download of the metrics may take a while.