Open Access
Fig. 3
Download original image
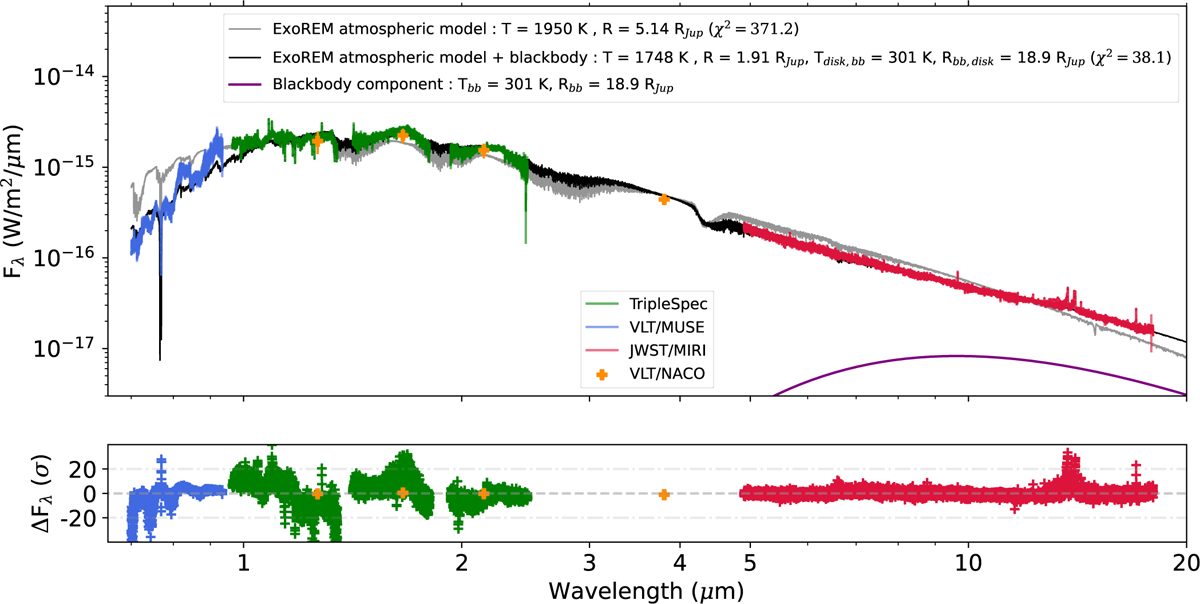
Delorme 1 AB b spectrum and photometric data from the visible to MIR along with the best-fit Exo-REM atmospheric models. The black curve includes an additional blackbody component to account for the observed MIR excess. More atmospheric model fits are available in Appendix A.
Current usage metrics show cumulative count of Article Views (full-text article views including HTML views, PDF and ePub downloads, according to the available data) and Abstracts Views on Vision4Press platform.
Data correspond to usage on the plateform after 2015. The current usage metrics is available 48-96 hours after online publication and is updated daily on week days.
Initial download of the metrics may take a while.