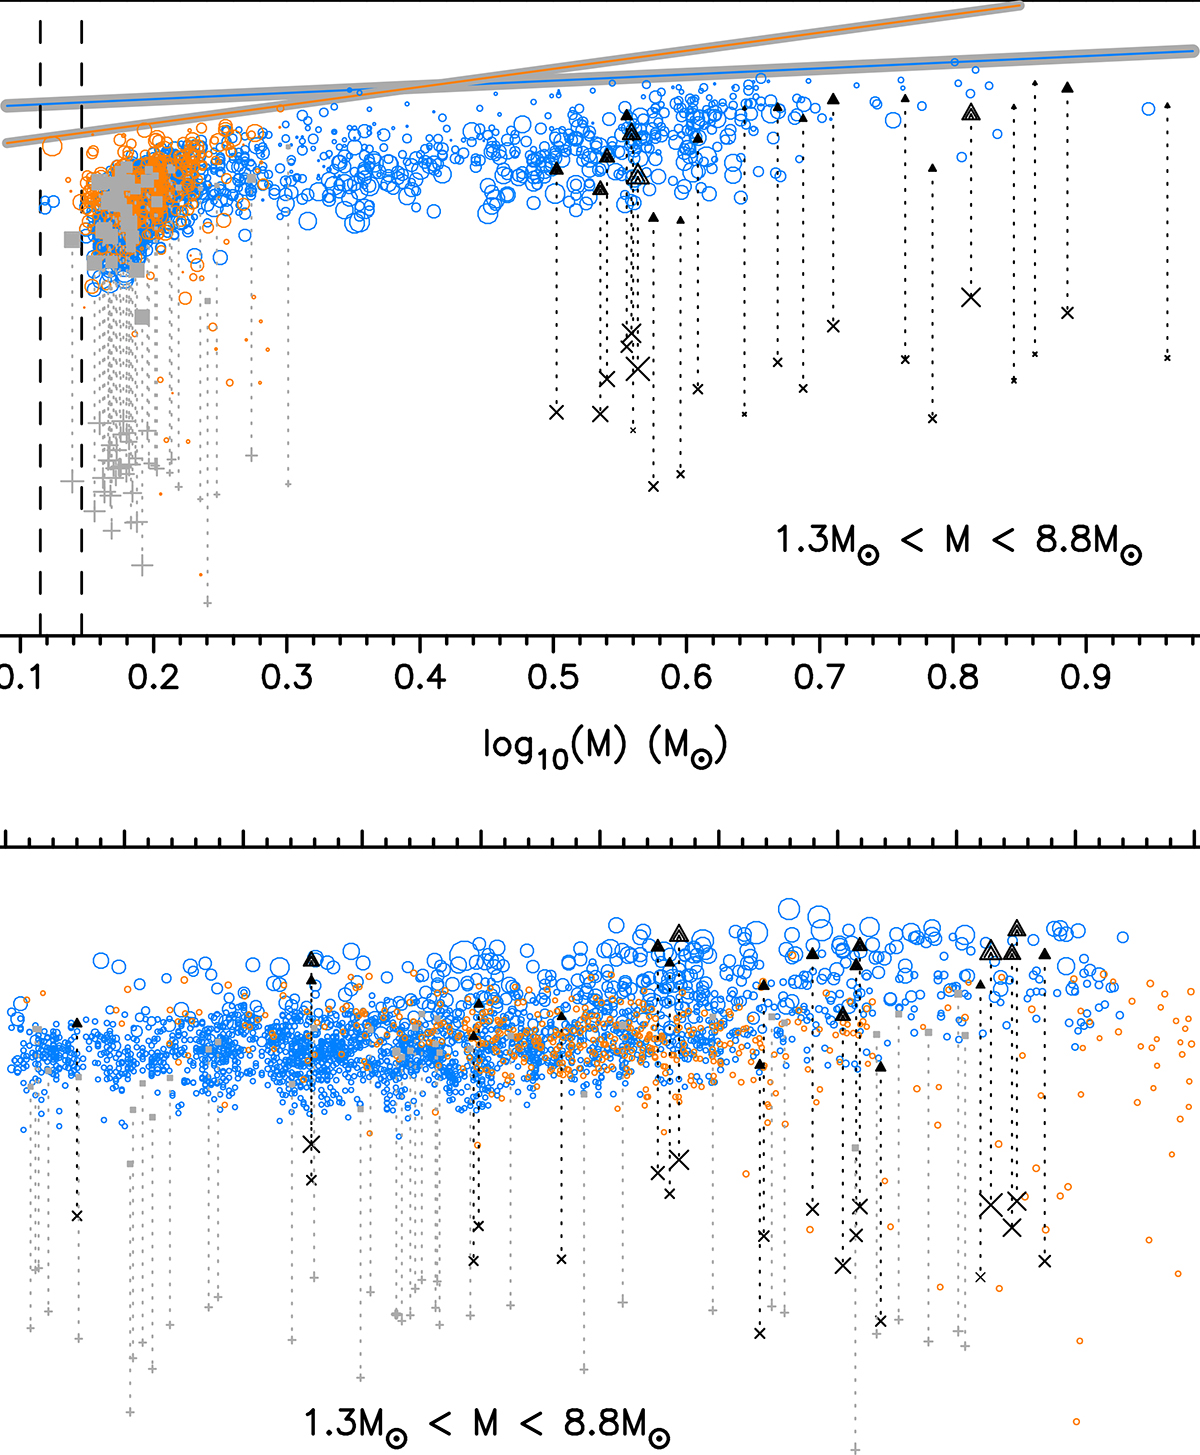
Fig. 3.
Download original image
Specific angular momentum, J/M, plotted logarithmically against stellar mass (upper panel) and evolutionary stage (lower panel). The symbol size for each star scales linearly with its evolutionary stage Xc/Xini (upper panel) and mass (lower panel). The circles show the stars of Samples 1 and 2. Also shown are the J/M values of 21 SPB stars from Pedersen (2022a,b triangles, from her Tables 4 and 5), connected by a dotted line to the specific angular momentum of their convective core deduced from asteroseismic modelling of individual identified modes (shown as ×). Similarly, J/M of the 37 asteroseismically modelled γ Dor stars from Mombarg et al. (2021) are shown as filled squares connected to the specific angular momentum of their convective core (shown as +). The two dashed vertical lines in the upper panel indicate the mass regime [1.3, 1.4] M⊙ where the Kraft break occurs. The two coloured full lines and their uncertainty regions (in grey) denote the upper limits of the J/M measurements for each of the two samples.
Current usage metrics show cumulative count of Article Views (full-text article views including HTML views, PDF and ePub downloads, according to the available data) and Abstracts Views on Vision4Press platform.
Data correspond to usage on the plateform after 2015. The current usage metrics is available 48-96 hours after online publication and is updated daily on week days.
Initial download of the metrics may take a while.