Open Access
Fig. B.2
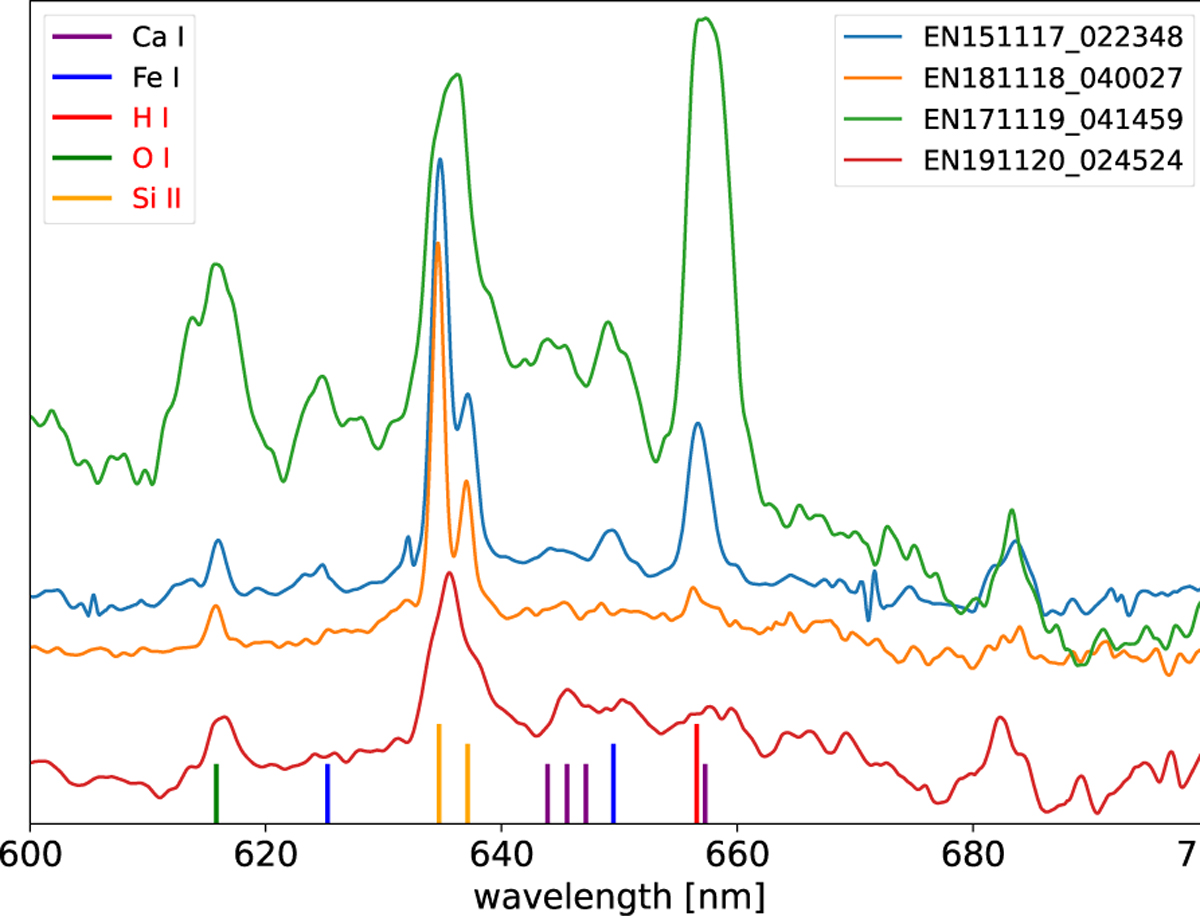
Download original image
Spectral region of ionised silicon and neutral hydrogen for Leonid spectra. The theoretical positions of selected element lines are marked. The high-temperature component lines are shown in red font (see left inset).
Current usage metrics show cumulative count of Article Views (full-text article views including HTML views, PDF and ePub downloads, according to the available data) and Abstracts Views on Vision4Press platform.
Data correspond to usage on the plateform after 2015. The current usage metrics is available 48-96 hours after online publication and is updated daily on week days.
Initial download of the metrics may take a while.