Fig. 9
Download original image
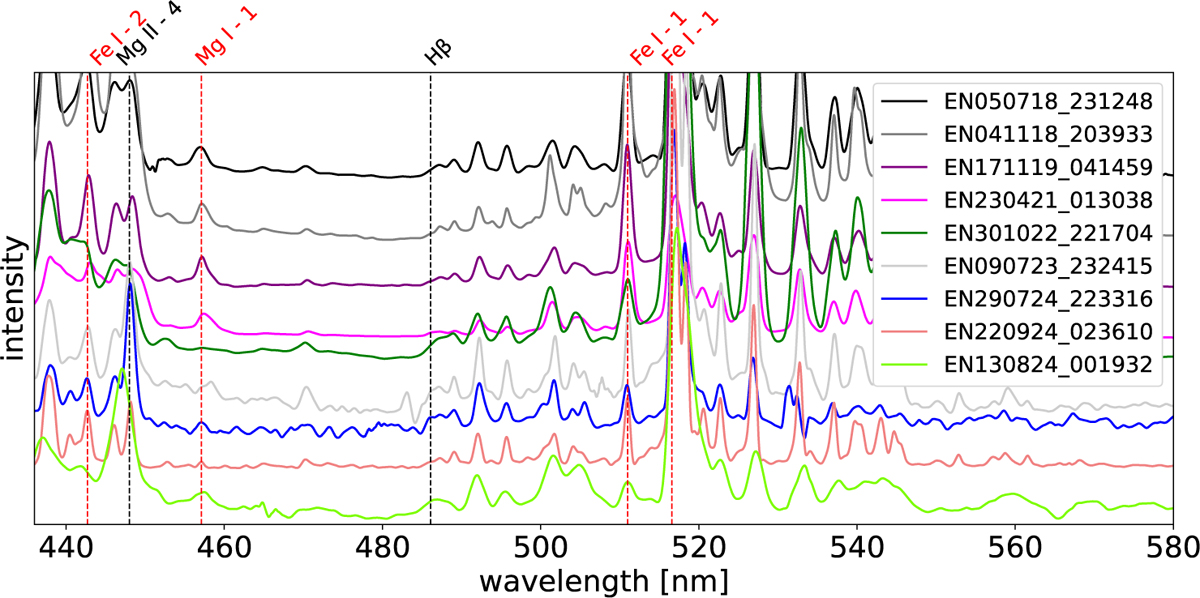
Spectral region between 440 nm and 580 nm of meteors with intercombination Mg I line. The spectral intensities are manually scaled and offset. The theoretical positions of the high-temperature lines are marked with black vertical dashed lines and the positions of the intercombination lines are marked with red vertical dashed lines.
Current usage metrics show cumulative count of Article Views (full-text article views including HTML views, PDF and ePub downloads, according to the available data) and Abstracts Views on Vision4Press platform.
Data correspond to usage on the plateform after 2015. The current usage metrics is available 48-96 hours after online publication and is updated daily on week days.
Initial download of the metrics may take a while.