Open Access
Fig. 1
Download original image
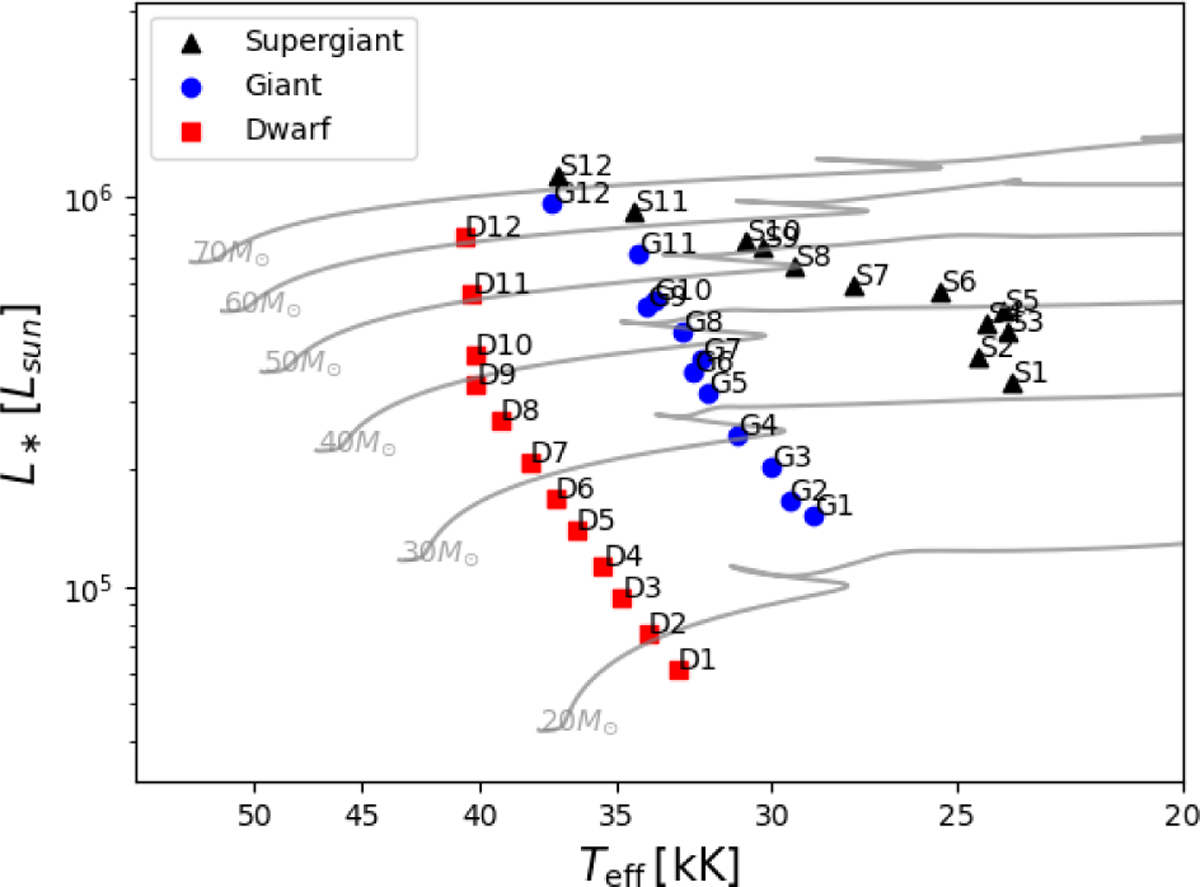
HRD positions after model relaxation for the entire grid. The gray lines indicate MIST (Dotter 2016) evolution tracks for non-rotating massive stars. The effective temperatures shown here are emergent properties of the simulation. Due to statistical scatter in very turbulent models, they do not line up in perfect sequences.
Current usage metrics show cumulative count of Article Views (full-text article views including HTML views, PDF and ePub downloads, according to the available data) and Abstracts Views on Vision4Press platform.
Data correspond to usage on the plateform after 2015. The current usage metrics is available 48-96 hours after online publication and is updated daily on week days.
Initial download of the metrics may take a while.