Open Access
Fig. 13
Download original image
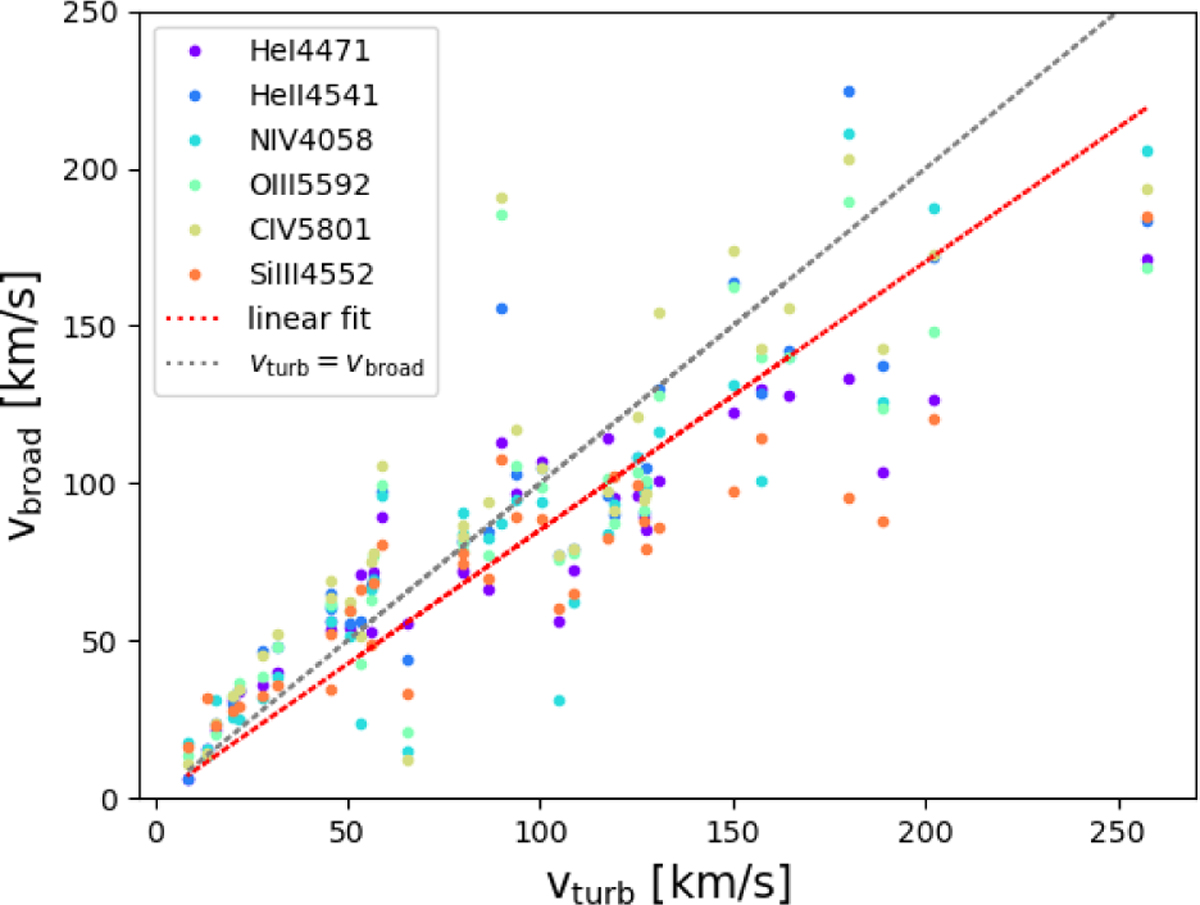
Correlation between the maximum, sub-photospheric turbulent velocity, and the one standard deviation width of the best fit turbulent broadening function. Different colors represent different atomic transitions and different locations on the horizontal axis correspond to different stellar models.
Current usage metrics show cumulative count of Article Views (full-text article views including HTML views, PDF and ePub downloads, according to the available data) and Abstracts Views on Vision4Press platform.
Data correspond to usage on the plateform after 2015. The current usage metrics is available 48-96 hours after online publication and is updated daily on week days.
Initial download of the metrics may take a while.