Fig. B.1
Download original image
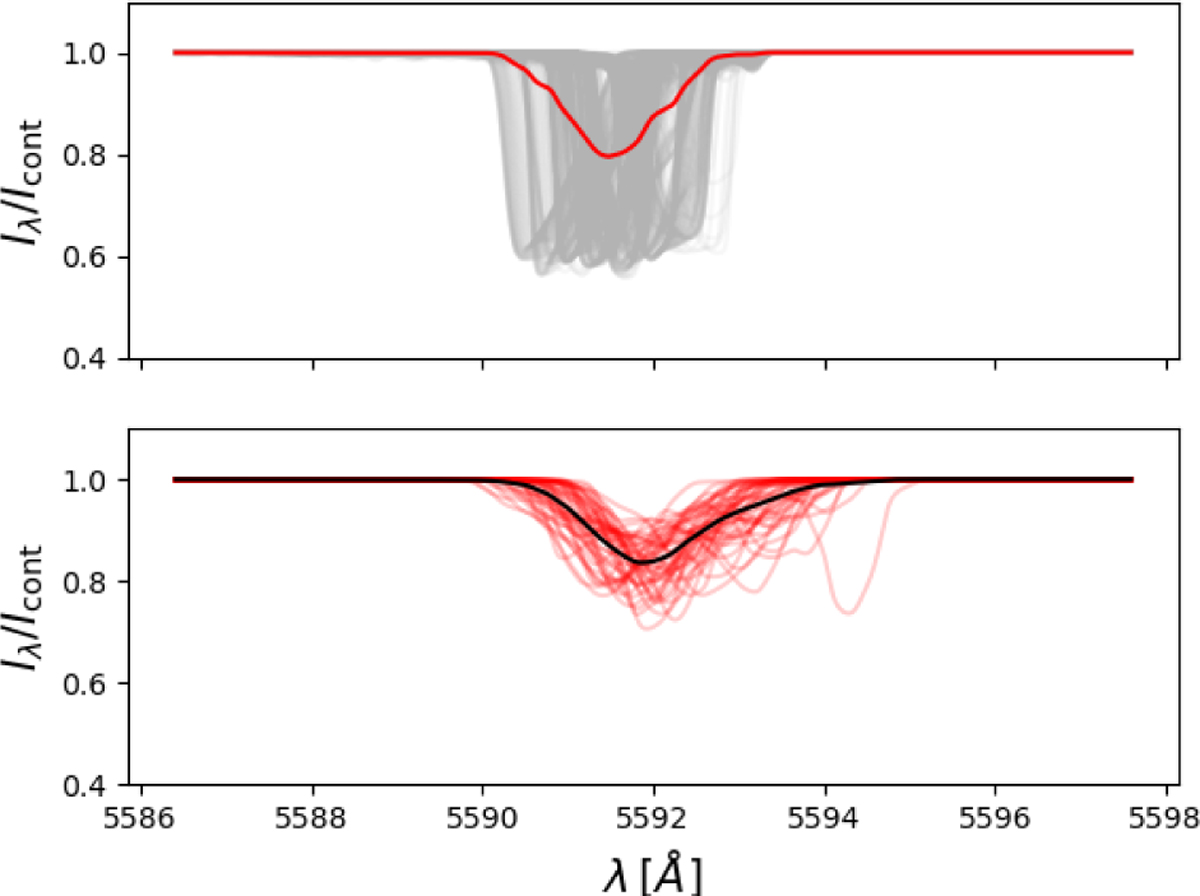
Temporal and lateral averaging of the radiative transfer routine. The top panel shows contributions from the 512 separate radial rays from a single snapshot (grey), along with their average (red). The bottom panel shows the 60 averages of 60 snapshots (red), together with the average of averages (black). The line corresponds to the OIII5592 transition in dwarf model D6.
Current usage metrics show cumulative count of Article Views (full-text article views including HTML views, PDF and ePub downloads, according to the available data) and Abstracts Views on Vision4Press platform.
Data correspond to usage on the plateform after 2015. The current usage metrics is available 48-96 hours after online publication and is updated daily on week days.
Initial download of the metrics may take a while.