Fig. 2
Download original image
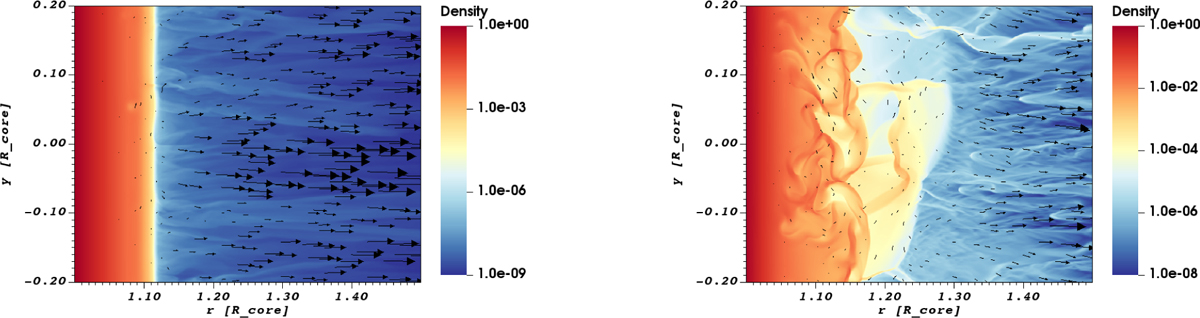
Density maps of a relatively steady atmosphere (left), corresponding to a dwarf model D1 and a relatively turbulent atmosphere (right), corresponding to a supergiant model S12. The velocity field is indicated by the black arrows. The density is given in units of the lower boundary density (see Table A.1), and the magnitude of the velocity peaks at 300 km/s.
Current usage metrics show cumulative count of Article Views (full-text article views including HTML views, PDF and ePub downloads, according to the available data) and Abstracts Views on Vision4Press platform.
Data correspond to usage on the plateform after 2015. The current usage metrics is available 48-96 hours after online publication and is updated daily on week days.
Initial download of the metrics may take a while.