Open Access
Fig. 3
Download original image
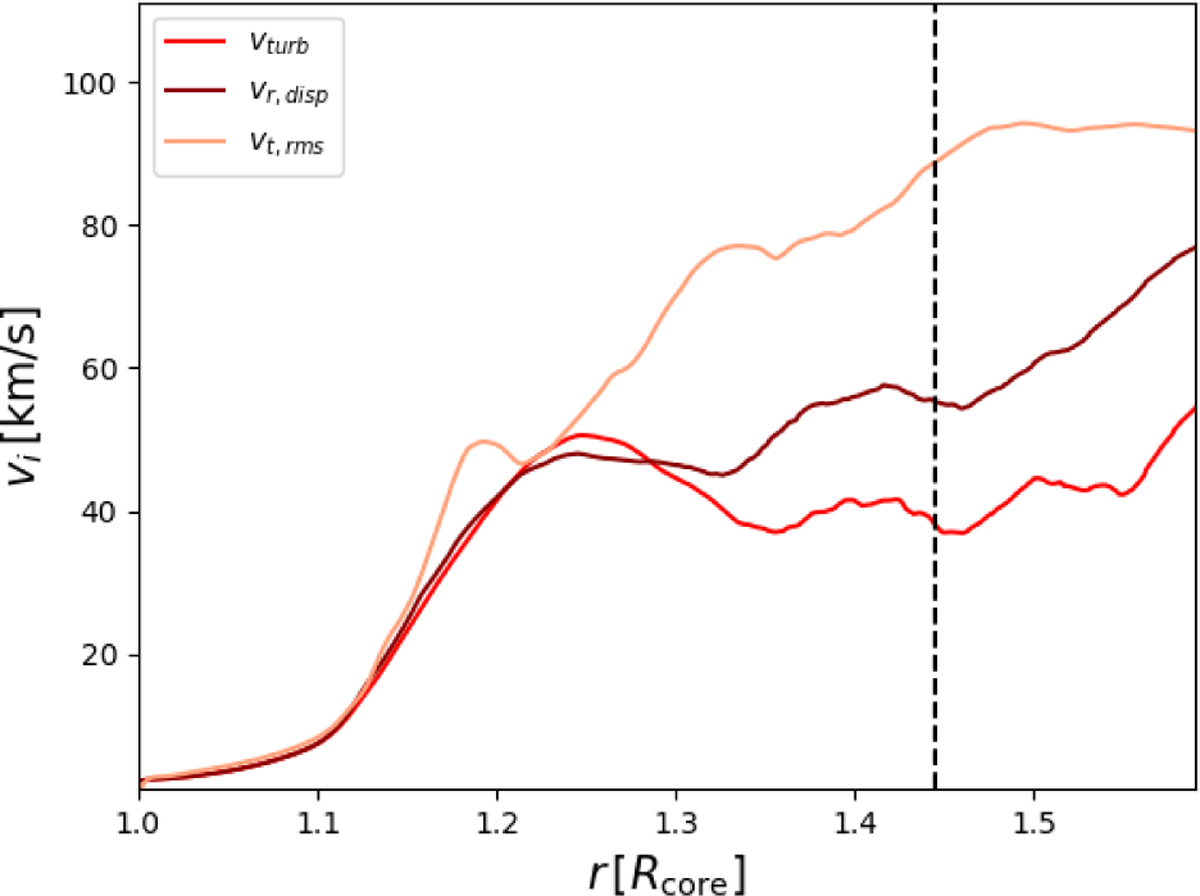
Value for the turbulent velocity as a function of radius for model G1. The vertical black line indicates the average model photosphere. The brown and pink lines indicate the radial and lateral velocity dispersions . The black dashed line represents the average photosphere.
Current usage metrics show cumulative count of Article Views (full-text article views including HTML views, PDF and ePub downloads, according to the available data) and Abstracts Views on Vision4Press platform.
Data correspond to usage on the plateform after 2015. The current usage metrics is available 48-96 hours after online publication and is updated daily on week days.
Initial download of the metrics may take a while.