Open Access
Fig. 7
Download original image
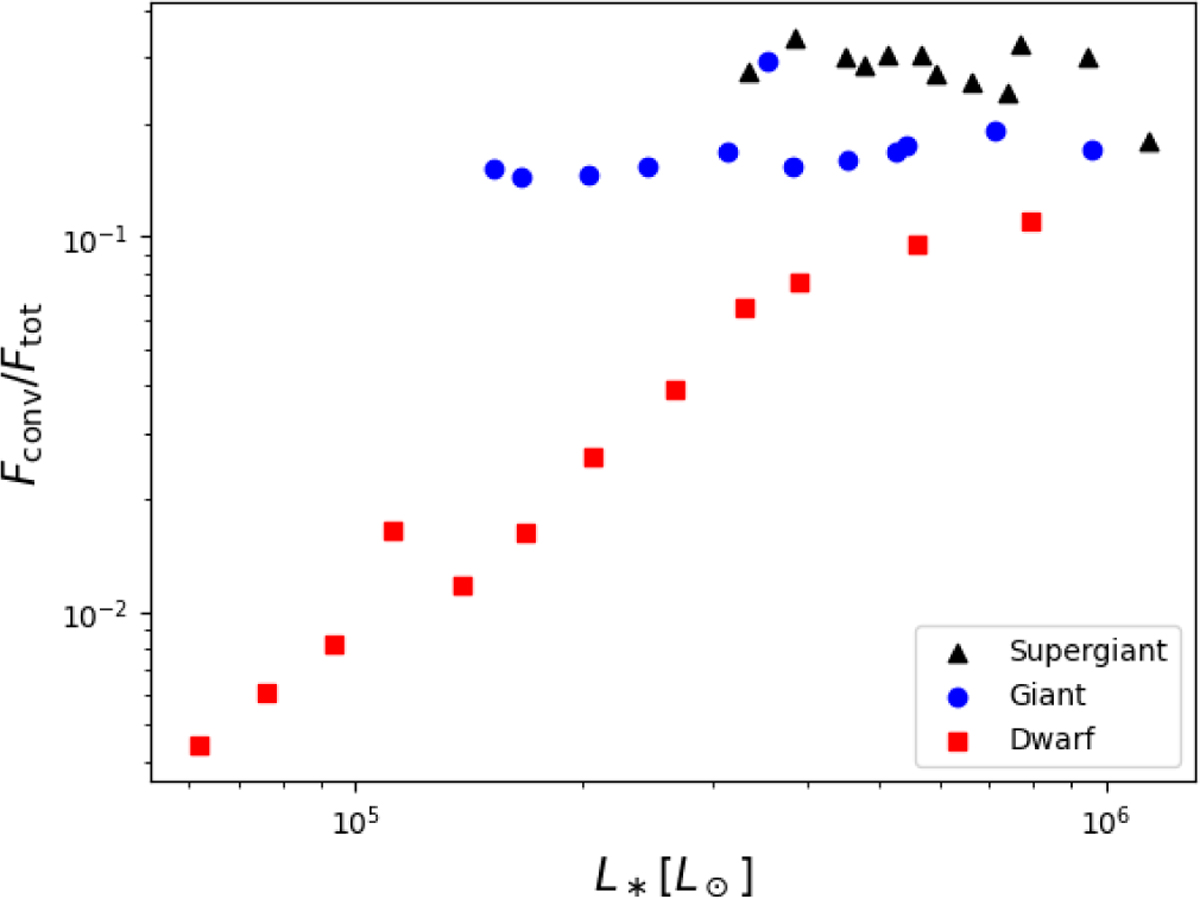
Maximum value of the ratio of convective to total energy flux as a function of stellar effective temperature for all of the simulations in our grid. Red squares indicate the series of dwarf models, blue circles the series of giants, and black triangles the series of supergiants.
Current usage metrics show cumulative count of Article Views (full-text article views including HTML views, PDF and ePub downloads, according to the available data) and Abstracts Views on Vision4Press platform.
Data correspond to usage on the plateform after 2015. The current usage metrics is available 48-96 hours after online publication and is updated daily on week days.
Initial download of the metrics may take a while.