Fig. D.1
Download original image
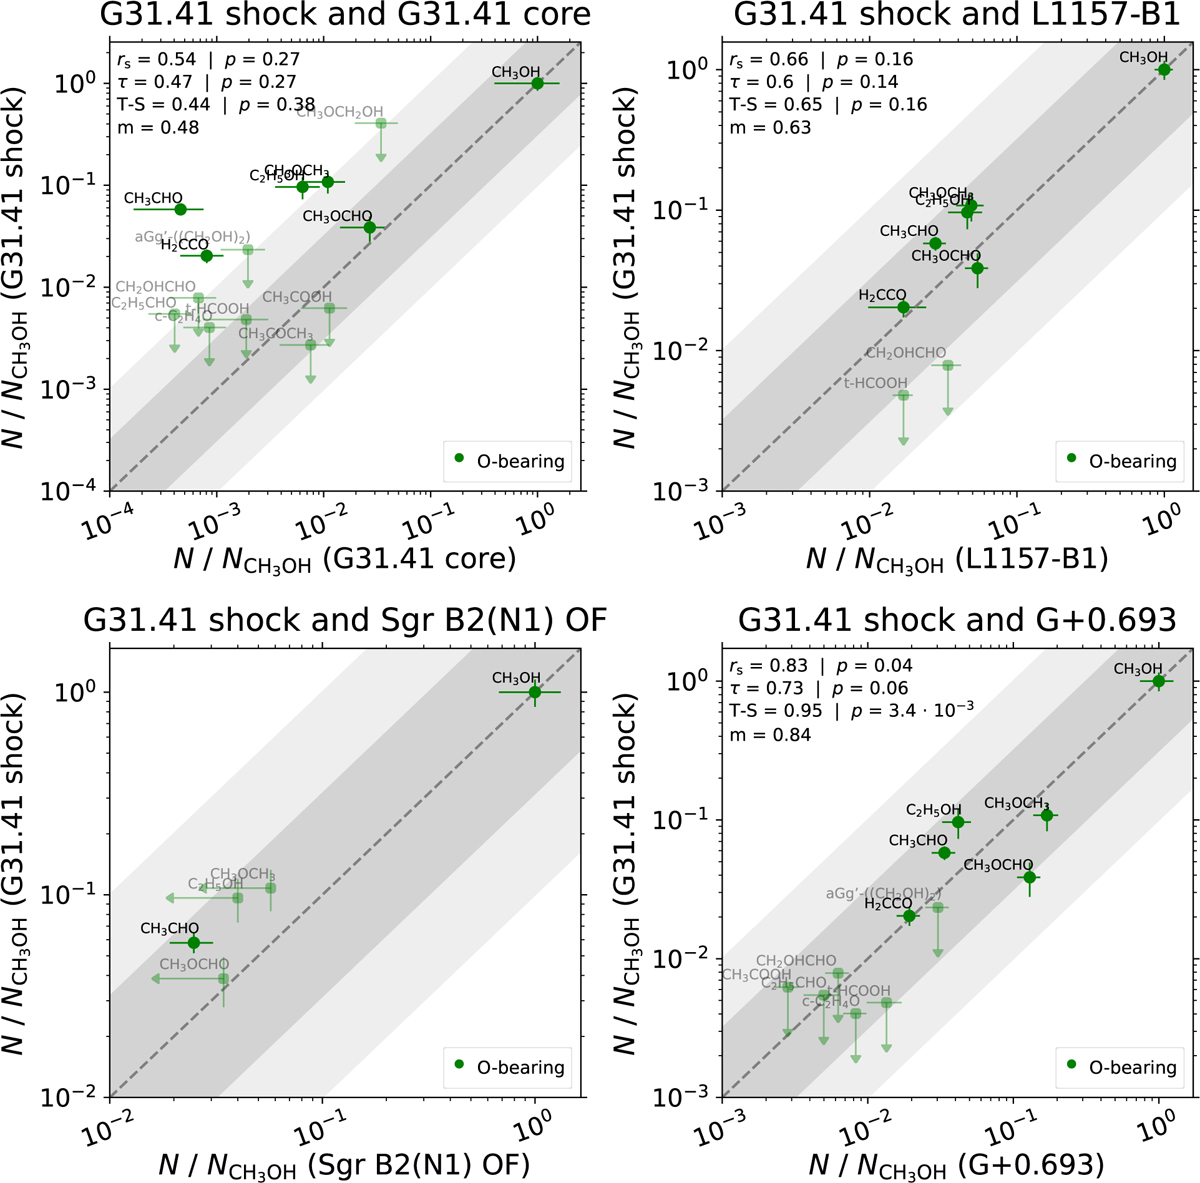
Comparison of the molecular ratios of the O-bearing molecules with respect to CH3OH in the G31.41 shock with those in G31.41 core (upper left), L1157-B1 shock (upper right), Sgr B2(N1) OF shock (lower left), and G+0.693 molecular cloud (lower right). The upper limits for undetected species are indicated with arrows. The light and dark shaded gray area corresponds to half and one order of magnitude scatter from the y=x relation denoted by the dashed line. The results of the correlation tests are indicated in the upper left corner of each panel: rs (Spearman), τ (Kendall), and T-S (Theil-Sen), with their associated p-values, and the average m (for details see Sect. 4.1).
Current usage metrics show cumulative count of Article Views (full-text article views including HTML views, PDF and ePub downloads, according to the available data) and Abstracts Views on Vision4Press platform.
Data correspond to usage on the plateform after 2015. The current usage metrics is available 48-96 hours after online publication and is updated daily on week days.
Initial download of the metrics may take a while.