Fig. 3
Download original image
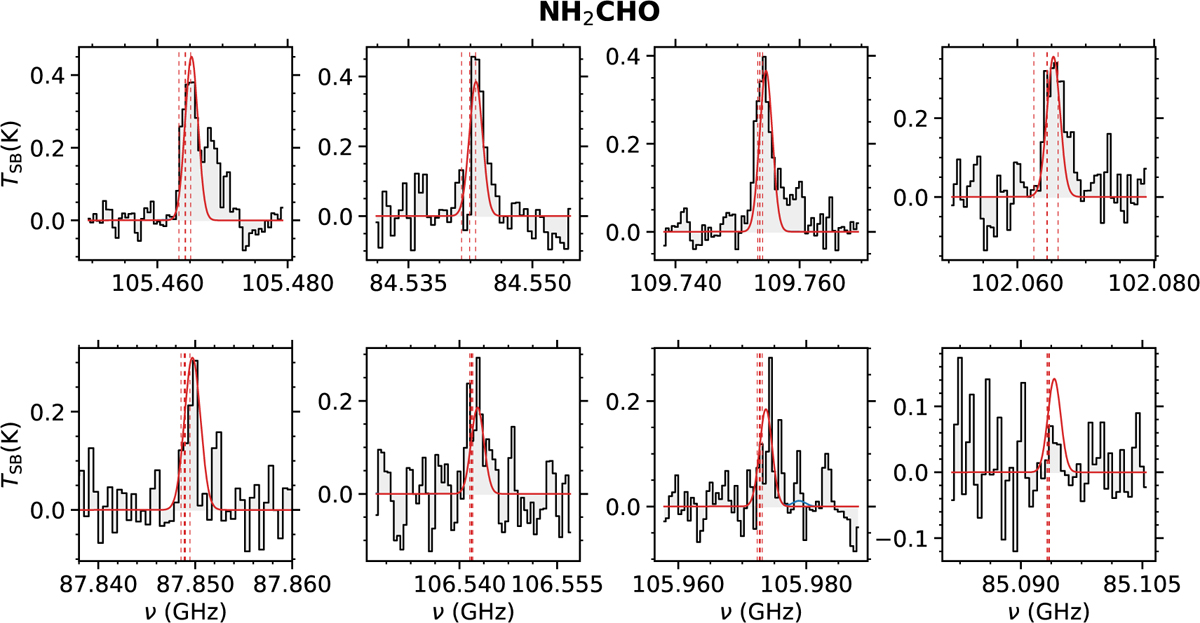
Transitions of NH2CHO detected toward the G31.41 shock position. The black histogram and its gray shadow represent the observed spectrum. The red curve shows the best LTE fit of the individual species, and the blue curve shows the cumulative fit considering all detected species. The dashed red lines indicate the frequency of the transitions we fit. The plots are sorted by decreasing line intensity of the transitions.
Current usage metrics show cumulative count of Article Views (full-text article views including HTML views, PDF and ePub downloads, according to the available data) and Abstracts Views on Vision4Press platform.
Data correspond to usage on the plateform after 2015. The current usage metrics is available 48-96 hours after online publication and is updated daily on week days.
Initial download of the metrics may take a while.