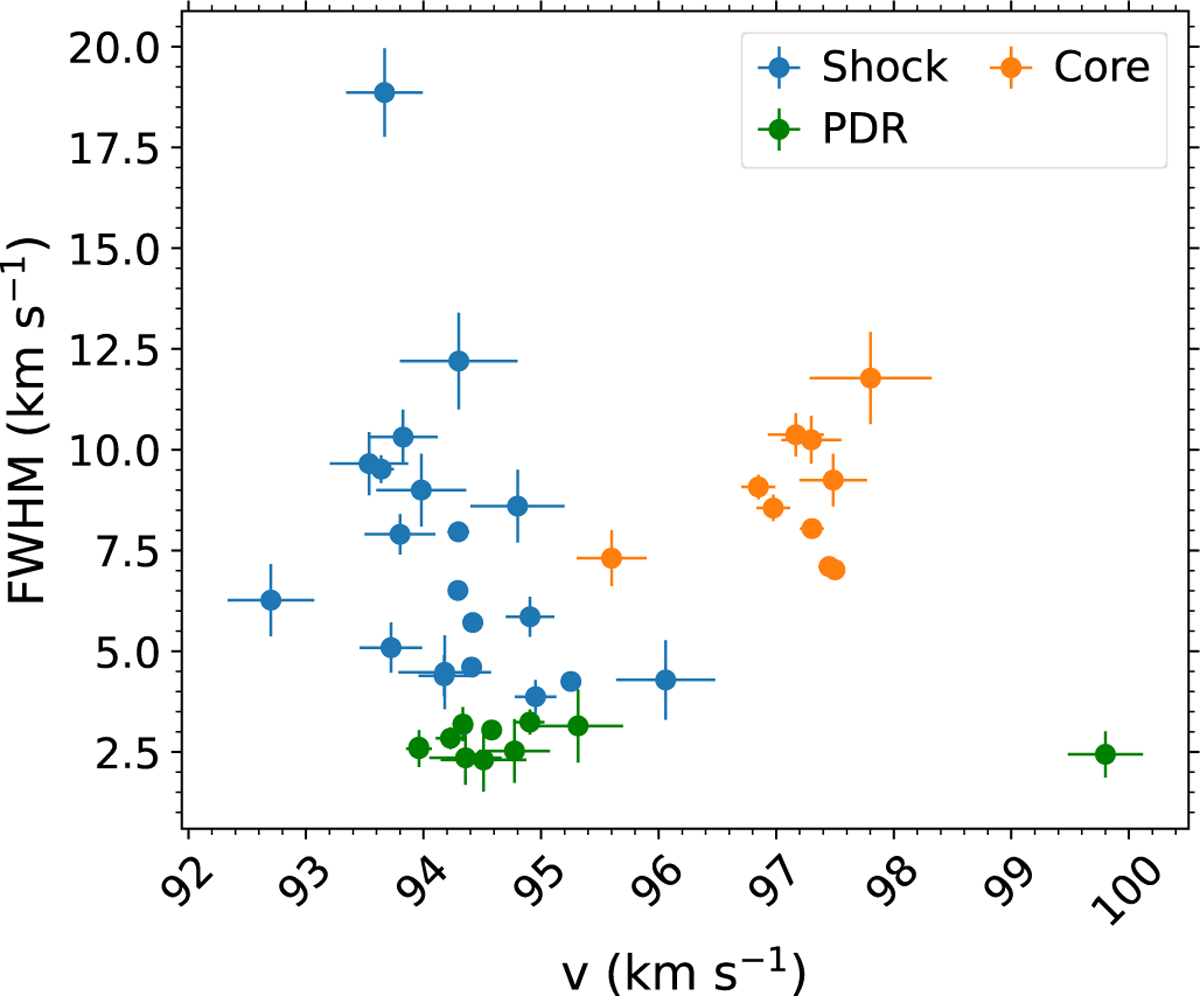
Fig. 5
Download original image
Comparison of the line widths and velocities of the molecules detected toward the G31.41 shock (from Table B.1 and from Paper IV) with those in the G31.41 core (from Table B.3; Papers I, II, III, and V). The species identified in the G31.41 shock are separated into two groups (see Sect. 3.4 for details): those directly related with the shock (blue dots), and those likely related with an extended PDR in the line of sight (green dots). The molecules detected in the core are indicated with orange dots. We only plot the molecules for which FWHM and v were left free in the fits.
Current usage metrics show cumulative count of Article Views (full-text article views including HTML views, PDF and ePub downloads, according to the available data) and Abstracts Views on Vision4Press platform.
Data correspond to usage on the plateform after 2015. The current usage metrics is available 48-96 hours after online publication and is updated daily on week days.
Initial download of the metrics may take a while.