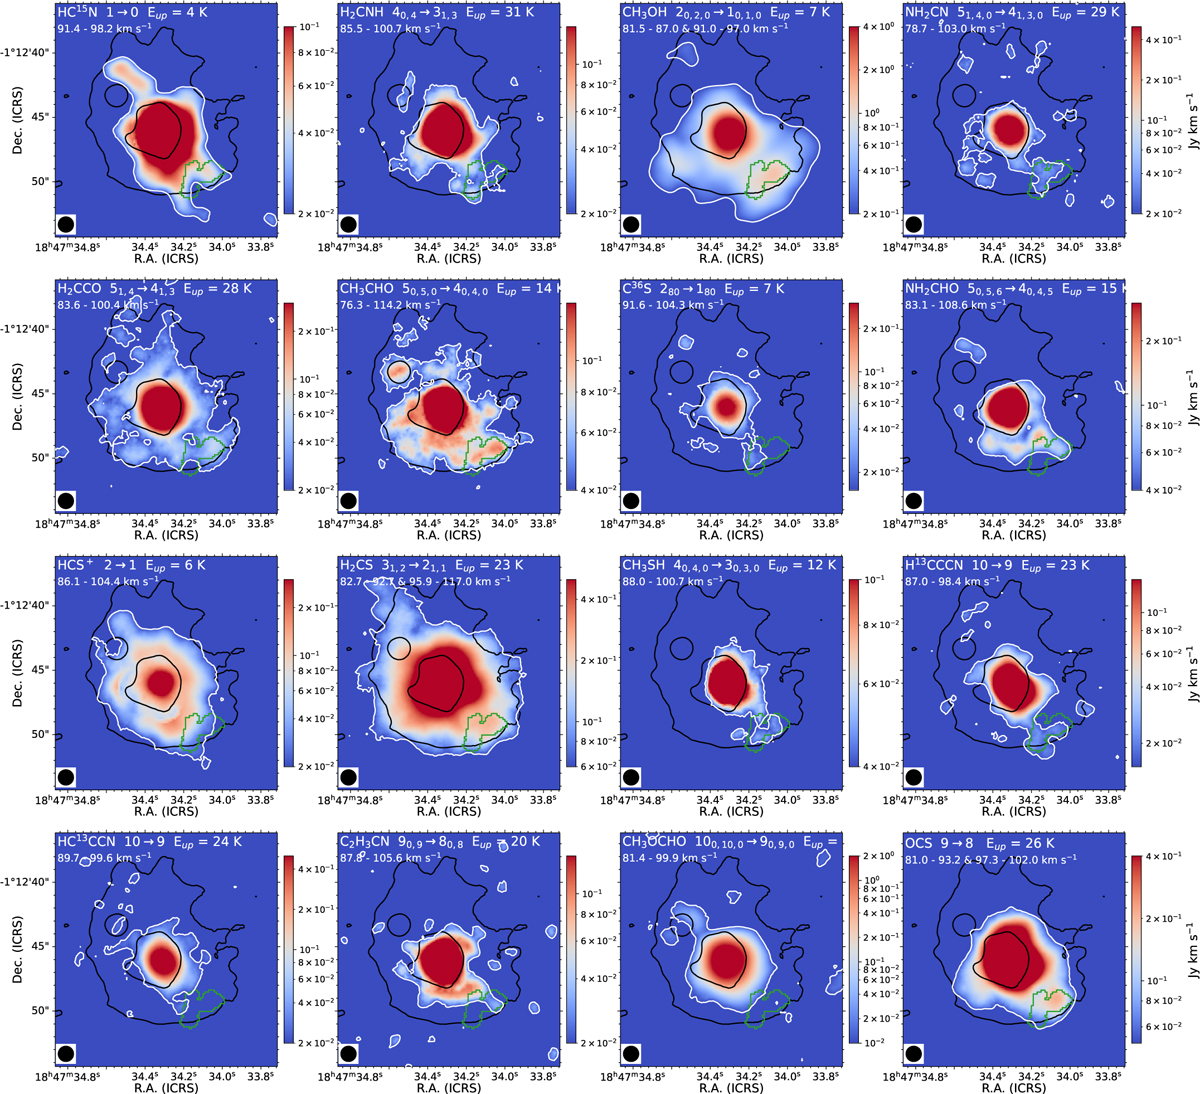
Fig. A.1
Download original image
Emission maps of detected molecules towards G31.41 shock. On each panel in the upper part of the panels is shown in white the molecule name, the molecular transition, the energy of the upper level and the velocity range. In addition, in green is labeled the G31.41 shock region according to region 2 of Fig. 1 in Fontani et al. (2024). The ultracompact HII region and the hot core of G31.41 are also labeled. The 3 and 20 σ contour levels of the 3mm continuum map at 98.5 GHz from Mininni et al. (2020) are plotted in black. The minimum flux level of the color bar of each panel is indicated by the white contours.
Current usage metrics show cumulative count of Article Views (full-text article views including HTML views, PDF and ePub downloads, according to the available data) and Abstracts Views on Vision4Press platform.
Data correspond to usage on the plateform after 2015. The current usage metrics is available 48-96 hours after online publication and is updated daily on week days.
Initial download of the metrics may take a while.