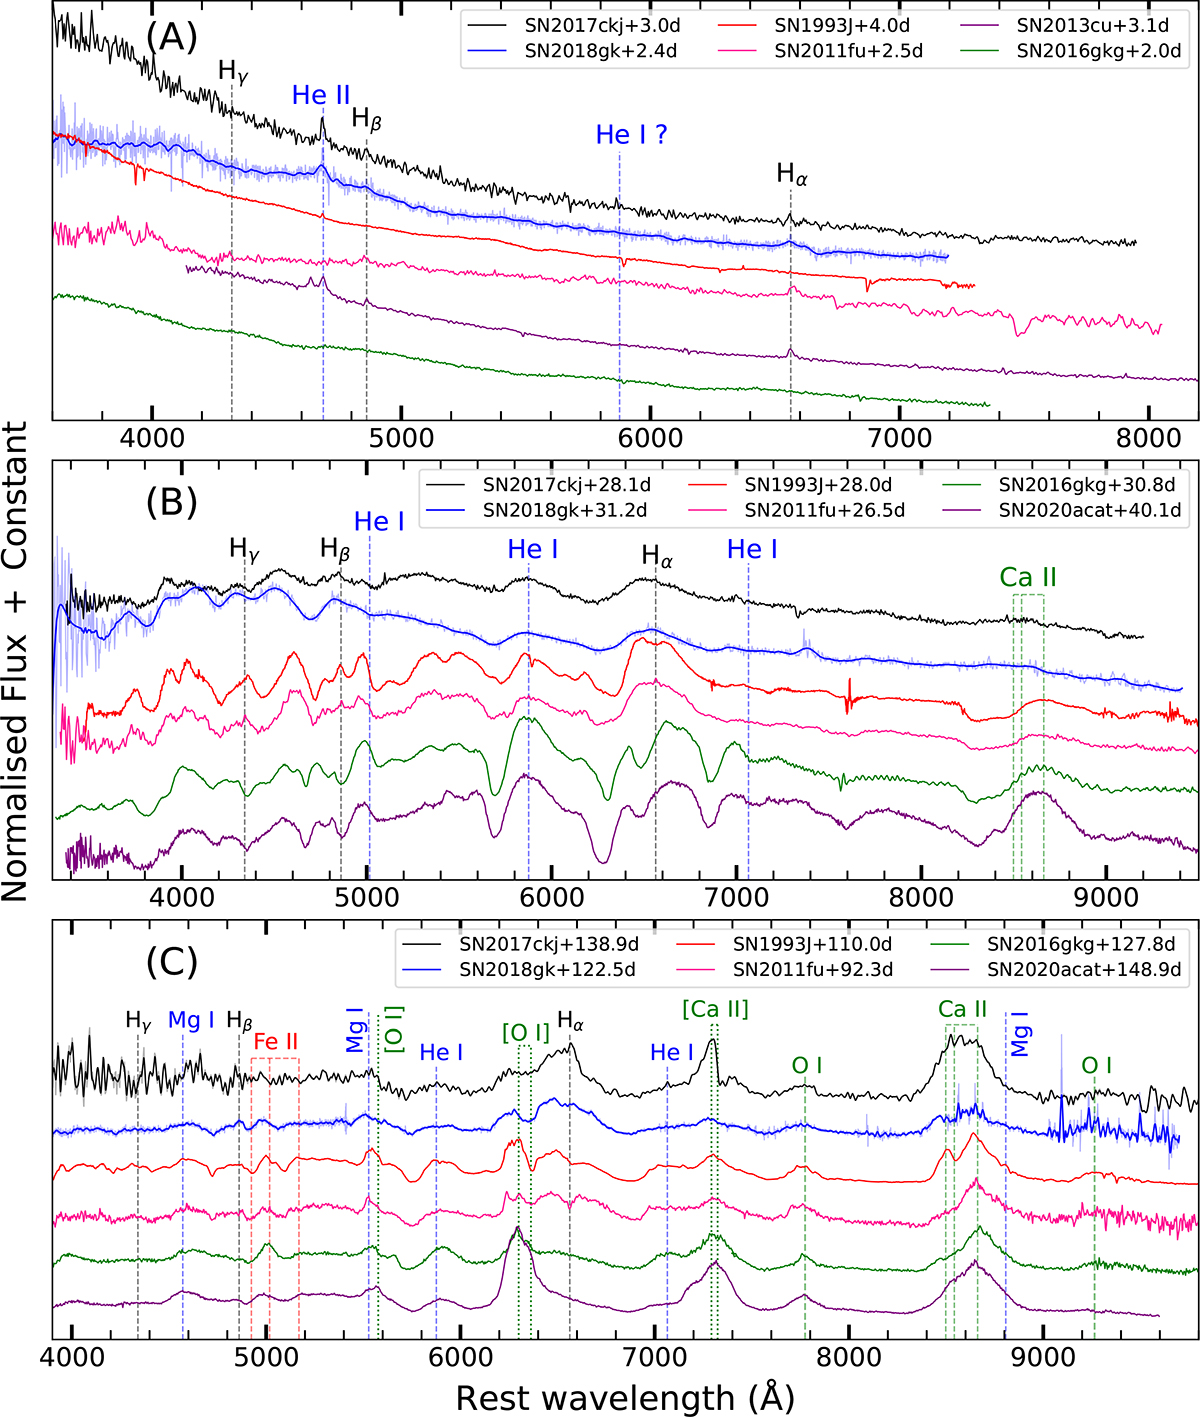
Fig. 10.
Download original image
Early-, intermediate-, and late-time spectroscopic comparisons of SNe IIb. Phase from the explosion date is given in the legend and all spectra are shown in the rest frame. All spectra have been corrected for redshift and extinction. The key line features are marked, with allowed transitions indicated by dashed lines and forbidden lines represented by dotted lines. Some spectra with lower S/N have been smoothed using a Savitzky-Golay filter.
Current usage metrics show cumulative count of Article Views (full-text article views including HTML views, PDF and ePub downloads, according to the available data) and Abstracts Views on Vision4Press platform.
Data correspond to usage on the plateform after 2015. The current usage metrics is available 48-96 hours after online publication and is updated daily on week days.
Initial download of the metrics may take a while.