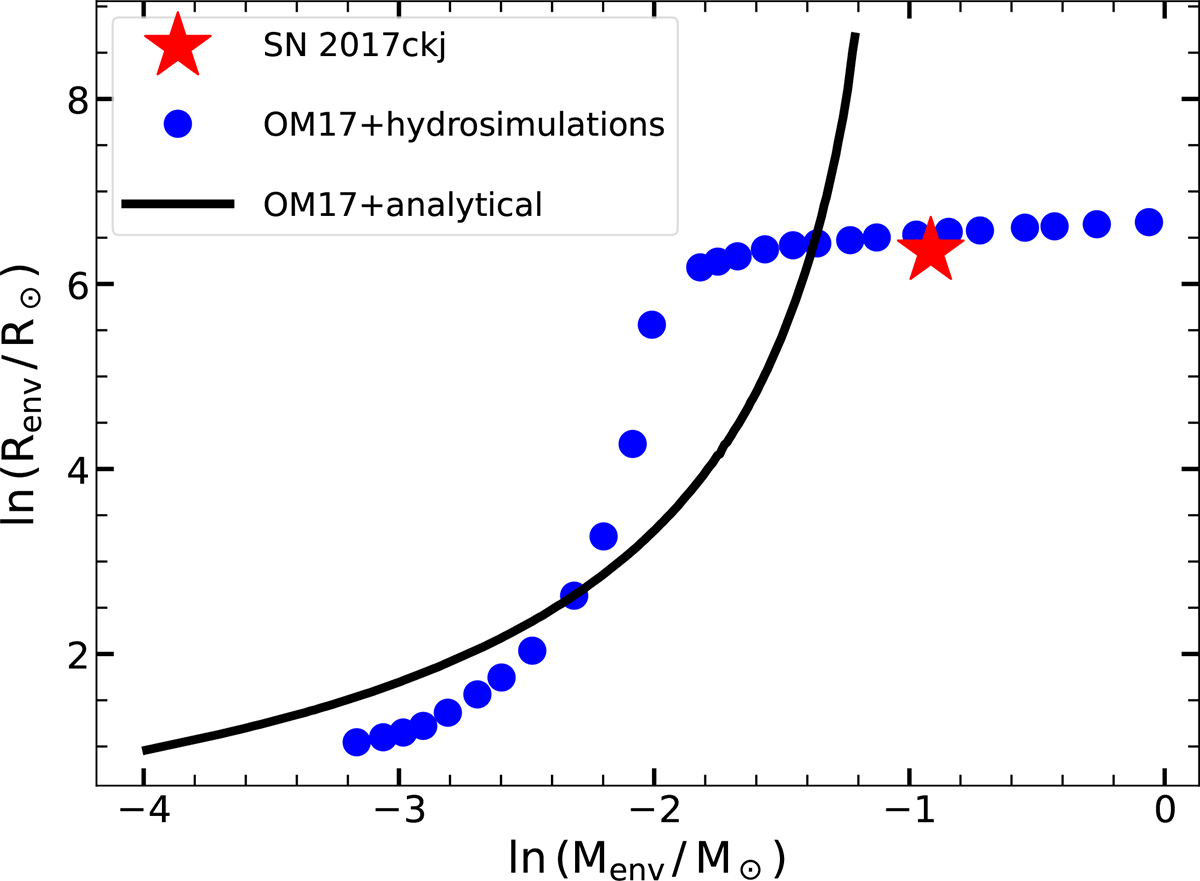
Fig. 13.
Download original image
Relation between the radius and mass of the envelope for the SNe IIb progenitor models (blue dots) from Ouchi & Maeda (2017). The black line represents the analytical relation derived by Ouchi & Maeda (2017), which captures the properties of the numerical evolution models. The parameters derived for SN 2017ckj are indicated by the red star. This figure is modified from Gangopadhyay et al. (2023).
Current usage metrics show cumulative count of Article Views (full-text article views including HTML views, PDF and ePub downloads, according to the available data) and Abstracts Views on Vision4Press platform.
Data correspond to usage on the plateform after 2015. The current usage metrics is available 48-96 hours after online publication and is updated daily on week days.
Initial download of the metrics may take a while.